Gauging Cryptocurrency Market Sentiment in R

Navigating the volatile world of cryptocurrencies requires a keen understanding of market sentiment. This blog post explores some of the essential tools and techniques for analyzing the mood of the crypto market, using the cryptoQuotes-package.

The Cryptocurrency Fear and Greed Index in R

The Fear and Greed Index is a market sentiment tool that measures investor emotions, ranging from 0 (extreme fear) to 100 (extreme greed). It analyzes data like volatility, market momentum, and social media trends to indicate potential overvaluation or undervaluation of cryptocurrencies. This index helps investors identify potential buying or selling opportunities by gauging the market’s emotional extremes.

This index can be retrieved by using the cryptoQuotes::getFGIndex()-function, which returns the daily index within a specified time-frame,

## Fear and Greed Index
## from the last 14 days
tail(
  FGI <- cryptoQuotes::getFGIndex(
    from = Sys.Date() - 14
  )
)
#>            FGI
#> 2024-01-03  70
#> 2024-01-04  68
#> 2024-01-05  72
#> 2024-01-06  70
#> 2024-01-07  71
#> 2024-01-08  71

The Long-Short Ratio of a Cryptocurrency Pair in R

The Long-Short Ratio is a financial metric indicating market sentiment by comparing the number of long positions (bets on price increases) against short positions (bets on price decreases) for an asset. A higher ratio signals bullish sentiment, while a lower ratio suggests bearish sentiment, guiding traders in making informed decisions.

The Long-Short Ratio can be retrieved by using the cryptoQuotes::getLSRatio()-function, which returns the ratio within a specified time-frame and granularity. Below is an example using the Daily Long-Short Ratio on Bitcoin (BTC),

## Long-Short Ratio
## from the last 14 days
tail(
  LSR <- cryptoQuotes::getLSRatio(
    ticker = "BTCUSDT",
    interval = '1d',
    from = Sys.Date() - 14
  )
)
#>              Long  Short LSRatio
#> 2024-01-03 0.5069 0.4931  1.0280
#> 2024-01-04 0.6219 0.3781  1.6448
#> 2024-01-05 0.5401 0.4599  1.1744
#> 2024-01-06 0.5499 0.4501  1.2217
#> 2024-01-07 0.5533 0.4467  1.2386
#> 2024-01-08 0.5364 0.4636  1.1570

Putting it all together

Even though cryptoQuotes::getLSRatio() is an asset-specific sentiment indicator, and cryptoQuotes::getFGIndex() is a general sentiment indicator, there is much information to be gathered by combining this information.

This information can be visualized by using the the various charting-functions in the cryptoQuotes-package,

## get the BTCUSDT
## pair from the last 14 days
BTCUSDT <- cryptoQuotes::getQuote(
  ticker = "BTCUSDT",
  interval = "1d",
  from = Sys.Date() - 14
)
## chart the BTCUSDT
## pair with sentiment indicators
cryptoQuotes::chart(
  slider = FALSE,
  chart = cryptoQuotes::kline(BTCUSDT) %>%
    cryptoQuotes::addFGIndex(FGI = FGI) %>% 
    cryptoQuotes::addLSRatio(LSR = LSR)
)
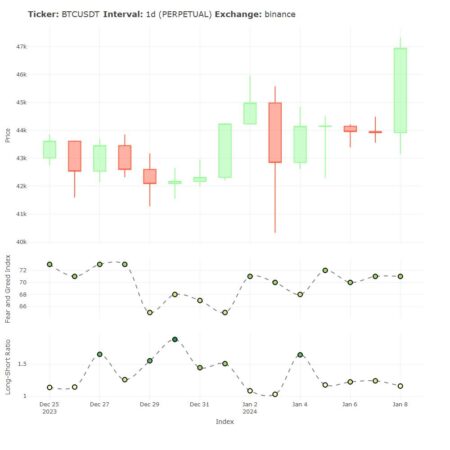
Bitcoin charted against Fear and Greed Index and the Long-Short Ratio using R
Bitcoin (BTC) plotted with Fear and Greed Index along side the Long-Short Ratio

Installing cryptoQuotes

Installing via CRAN

# install from CRAN
install.packages(
  pkgs = 'cryptoQuotes',
  dependencies = TRUE
)

Installing via Github

# install from github
devtools::install_github(
  repo = 'https://github.com/serkor1/cryptoQuotes/',
  ref = 'main'
)

Note: The latest price may vary depending on time of publication relative to the rendering time of the document. This document were rendered at 2024-01-08 23:30 CET
Cryptocurrency Market Data in R

Getting cryptocurrency OHLCV data in R without having to depend on low-level coding using, for example, curl or httr2, have not been easy for the R community.

There is now a high-level API Client available on CRAN which fetches all the market data without having to rely on web-scrapers, API keys or low-level coding.

Bitcoin Prices in R (Example)

This high-level API-client have one main function, getQuotes(), which returns cryptocurrency market data with a xts– and zoo-class. The returned objects contains Open, High, Low, Close and Volume data with different granularity, from the currently supported exchanges.

In this blog post I will show how to get hourly Bitcoin (BTC) prices in R
using the getQuotes()-function. See the code below,
# 1) getting hourly BTC
# from the last 3 days

BTC <- cryptoQuotes::getQuote(
 ticker   = "BTCUSDT", 
 source   = "binance", 
 futures  = FALSE, 
 interval = "1h", 
 from     = as.character(Sys.Date() - 3)
)
Bitcoin (BTC) OHLC-prices (Output from getQuote-function)
Index Open High Low Close Volume
2023-12-23 19:00:00 43787.69 43821.69 43695.03 43703.81 547.96785
2023-12-23 20:00:00 43703.82 43738.74 43632.77 43711.33 486.4342
2023-12-23 21:00:00 43711.33 43779.71 43661.81 43772.55 395.6197
2023-12-23 22:00:00 43772.55 43835.94 43737.85 43745.86 577.03505
2023-12-23 23:00:00 43745.86 43806.38 43701.1 43702.16 940.55167
2023-12-24 43702.15 43722.25 43606.18 43716.72 773.85301

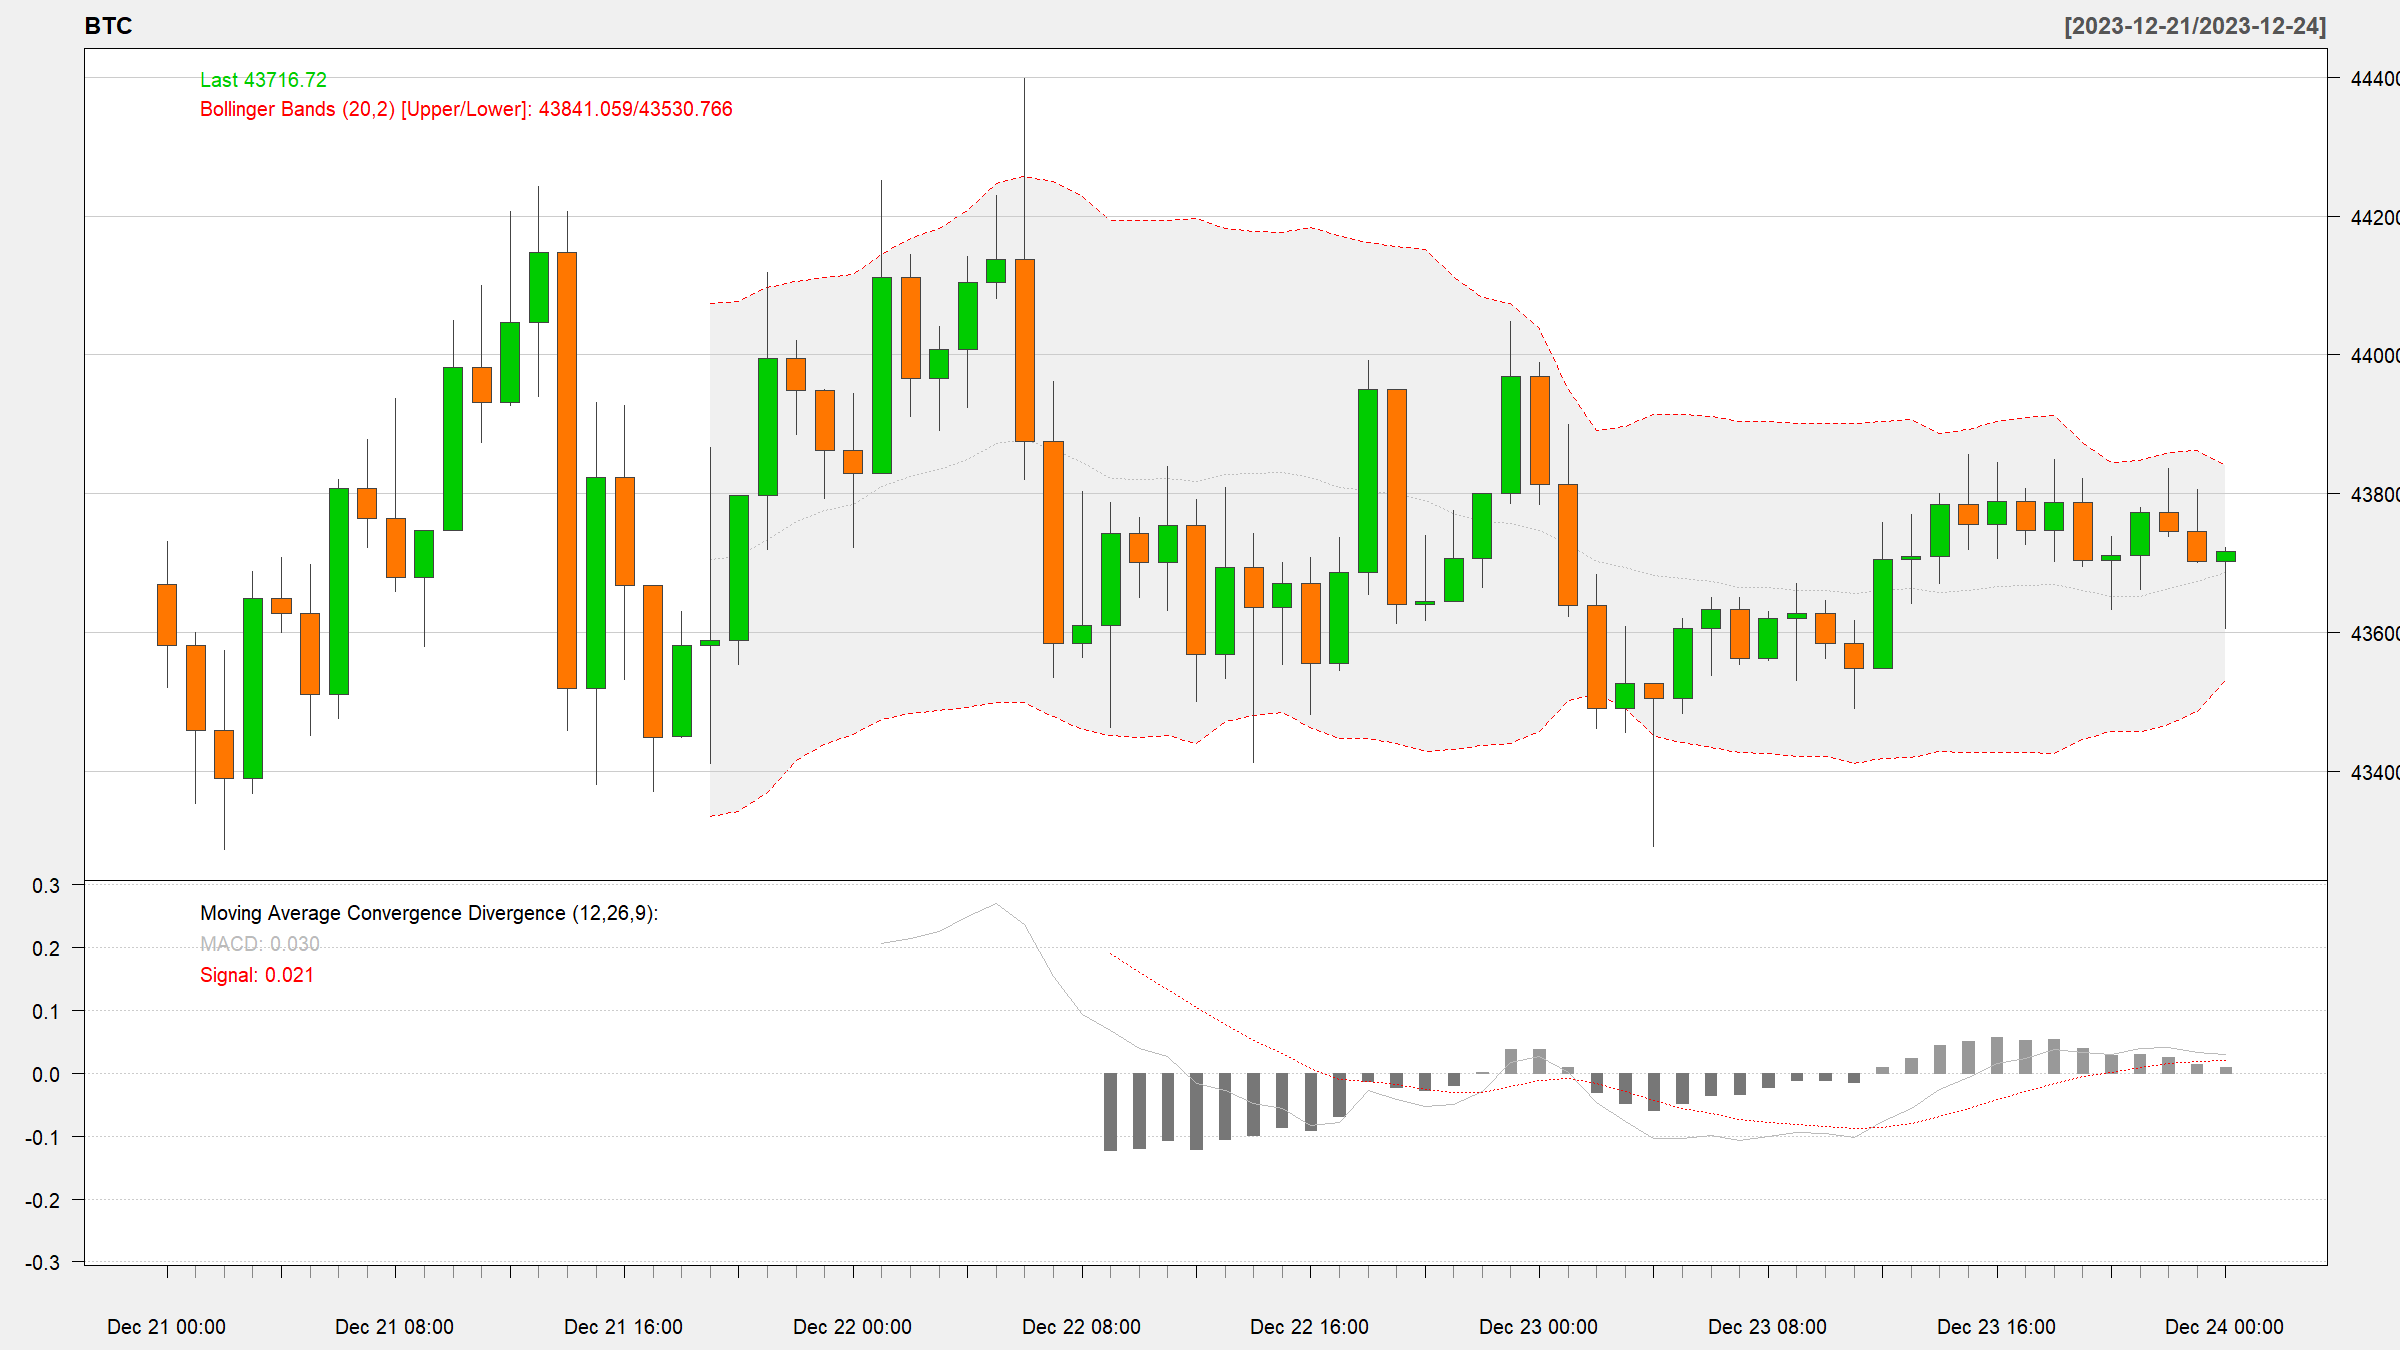
The returned Bitcoin prices from getQuotes() are compatible with quantmod and TTR, without further programming. Let me demonstrate this using chartSeries(), addBBands() and addMACD() from these powerful libraries,

# charting BTC
# using quantmod
quantmod::chartSeries(
 x = BTC,
 TA = c(
    # add bollinger bands
    # to the chart
    quantmod::addBBands(), 
    # add MACD indicator
    # to the chart
    quantmod::addMACD()
 ), 
 theme = quantmod::chartTheme("white")
)
Cryptocurrency charts using R
Charting Bitcoin prices using quantmod and TTR

Installing cryptoQuotes

Stable version

# install from CRAN
install.packages(
  pkgs = 'cryptoQuotes',
  dependencies = TRUE
)

Development version

# install from github
devtools::install_github(
  repo = 'https://github.com/serkor1/cryptoQuotes/',
  ref = 'main'
)

Visualising connection in R workshop

Join our workshop on Visualising connection in R, which is a part of our workshops for Ukraine series! 

Here’s some more info: 

Title: Visualising connection in R
Date: Thursday, November 9th, 19:00 – 21:00 CEST (Rome, Berlin, Paris timezone)
Speaker: Rita Giordano is a freelance data visualisation consultant and scientific illustrator based in the UK. By training, she is a physicist who holds a PhD in statistics applied to structural biology. She has extensive experience in research and data science. Furthermore, she has over fourteen years of professional experience working with R. She is also a LinkedIn instructor. You can find her course “Build Advanced Charts with R” on LinkedIn Learning.
Description: How to show connection? It depends on the connection we want to visualise. We could use a network, chord, or Sankey diagram.  The workshop will focus on how to visualise connections using chord diagrams. We will explore how to create a chord diagram with the {circlize} package.  In the final part of the workshop, I will briefly mention how to create a Sankey diagram with networkD3. Attendees need to have installed the {circlize} and {networkD3} packages.  
Minimal registration fee: 20 euro (or 20 USD or 800 UAH)


How can I register?


  • Save your donation receipt (after the donation is processed, there is an option to enter your email address on the website to which the donation receipt is sent)
  • Fill in the registration form, attaching a screenshot of a donation receipt (please attach the screenshot of the donation receipt that was emailed to you rather than the page you see after donation).

If you are not personally interested in attending, you can also contribute by sponsoring a participation of a student, who will then be able to participate for free. If you choose to sponsor a student, all proceeds will also go directly to organisations working in Ukraine. You can either sponsor a particular student or you can leave it up to us so that we can allocate the sponsored place to students who have signed up for the waiting list.


How can I sponsor a student?

  • Save your donation receipt (after the donation is processed, there is an option to enter your email address on the website to which the donation receipt is sent)
  • Fill in the sponsorship form, attaching the screenshot of the donation receipt (please attach the screenshot of the donation receipt that was emailed to you rather than the page you see after the donation). You can indicate whether you want to sponsor a particular student or we can allocate this spot ourselves to the students from the waiting list. You can also indicate whether you prefer us to prioritize students from developing countries when assigning place(s) that you sponsored.

If you are a university student and cannot afford the registration fee, you can also sign up for the waiting list here. (Note that you are not guaranteed to participate by signing up for the waiting list).


You can also find more information about this workshop series,  a schedule of our future workshops as well as a list of our past workshops which you can get the recordings & materials here.


Looking forward to seeing you during the workshop!


Ebook launch – Simple Data Science (R)

Simple Data Science (R) covers the fundamentals of data science and machine learning. The book is beginner-friendly and has detailed code examples. It is available at scribd.

cover image

Topics covered in the book –
  • Data science introduction
  • Basic statistics
  • Graphing with ggplot2 package
  • Exploratory Data Analysis
  • Machine Learning with caret package
  • Regression, classification, and clustering
  • Boosting with lightGBM package
  • Hands-on projects
  • Data science use cases

Why this is the year you should take the stage at EARL 2022…

EARL is Europe’s largest R community event dedicated to showcasing commercial applications of the R language. As a conference, it has always lived up to its promise of connecting and inspiring R users with creative suggestions and solutions, sparking new ideas, solving problems and sharing perspectives to advance the community. 

2022 marks the return of face-to-face EARL (6th – 8th September at the Tower Hotel in London) – now run by Ascent, the new home of Mango Solutions. Over the past eight years, EARL has attracted some fascinating presentations from some engaging, authentic speakers, both experienced and first timers. This year, we’re keen to understand how recent global events and trends that have disrupted our view of ‘normal’ have impacted, changed or driven your R projects: from inspirational innovation to reducing operational cost and creating richer customer experiences. If you have an interesting application of R, our call for abstracts is now open and we’re inviting you to share your synopsis with us. Deadline for submissions is Thursday 30th June.  Maybe you’ve built a Shiny app that helps detect bias, or you’ve been on a data journey you’d like to share. Perhaps you’ve built a data science syllabus for young minds or created an NLP tool to automate clinical processes. If you are searching for inspiration, potential applications of R might come under the following categories:
  • Responding to global events with R
  • The role of R in the business data science toolbox
  • Overcoming the challenges of using R commercially
  • Efficient R: dealing with huge data
  • Sustainable R / R for good
  • R tools & packages (eg. Shiny R, Purrr)
  • Building your R community
  • Women in R
  • The future of R in enterprise: 2022 and beyond
We are also looking for short form submissions: 10-minute lightning talks on a wide range of applications.

What’s presenting at EARL really like?  

We asked our 2019 presenters what prompted their decision to speak at our last in-person EARL and their advice to others who may be considering submitting an abstract for EARL 2022. For Mitchell Stirling, Capacity and Modelling Manager at Heathrow Airport, the opportunity to present helped fulfil a professional ambition. “I discussed with my line manager, slightly tongue in cheek, that it should be an ambition in 2019 when he signed off a conference attendance in Scotland the previous year. As the work I’d been doing developed in 2019 and the opportunity presented itself, I started to think “why not?” – this is interesting and if I can show it interestingly, hopefully others would agree. I was slightly wary of the technical nature of the event, with my exposure to coding in R still better measured in minutes than hours (never mind days) but a reassurance that people would be interested in the ‘what’ and ‘why’ as well as the ‘how’, won me over.”  Dr Zhanna Mileeva, a Data Scientist at NBrown Group confirmed that making a contribution to the data science community was an important factor in her decision to submit an abstract: “After some research I found the EARL conference as a great cross-sector forum for R users to share Data Science, AI and ML engineering knowledge, discuss modern business problems and pathways to solutions. It was a fantastic opportunity to contribute to this community, learn from it and re-charge with some fresh ideas.” In past years EARL has attracted speakers from across the globe and last year, Harold Selman, Lead Data Scientist at Ordina (NL) came from the Netherlands to speak at the conference. “I knew the EARL conference as a visitor and had given some presentations in The Netherlands, so I decided to give it a shot. The staff of the EARL conference are very helpful and open to questions, which made being a speaker very pleasant.”  Some of our presenters have enjoyed the experience so much they have presented more than once. Chris Billingham, Lead Data Scientist at Manchester Airport Group’s Digital Agency MAG-O, is one such speaker. “I’ve had the good fortune to present twice at EARL.  I saw it as an opportunity to challenge myself to present at the biggest R conference in the UK.” 

How to submit your abstract. 

Feeling inspired? You can find the abstract submission form on our website. Here’s our recommendations for a successful submission.
  • Topic: Your topic can relate to any real-world application of R. We aim to represent a range of industry sectors and a balance of technical and strategic content.
  • Clarity: The talk synopsis should provide an overview of the topic and why you believe it will be of interest or resonate with the audience. We suggest an introduction or problem statement alongside any supporting facts that determine the talk objectives or expected takeaways.
  • Storytelling: Aim to demonstrate how the tools and techniques you used helped to transform and translate value with a clear and compelling narrative.
  • Approval: Before you submit, it’s a good idea to ensure your application has been approved by your wider organisation and or team.
  • Novel: Is the application particularly new or innovative? If your application of R is new or distinctive and not widely written about in the industry, please provide as much supporting information as you can for review purposes.
  • Target audience: 34% of our attendees are R practitioners and 46% of delegates typically have senior or leadership roles – consider the alignment of your proposal with these audiences.
We hope these hints and tips have been helpful – but feel free to get in touch if you have any questions by contacting [email protected]. 

EARL your way: book your tickets now!

Your EARL tickets are now live to purchase here. Offering you every possible EARL ticket combination, here is a quick summary of what you can expect. You can simply choose a 3-day jam-packed conference pass or a 1 or 2-day option to customise an itinerary that works for you.

Grab your EARLy bird tickets right away – limited for a period of 2 weeks and 2 weeks only, we are delighted to be offering an unlimited amount of tickets ranging from 15-25% discount on all ticket options, depending if you are NHS, not for profit or an academic.

Team networking.

Why not bring your colleagues along for a much needed team social at the largest commercial R event in the UK? Offering lots of networking opportunities from brands in similar markets – there will be plenty of time to swap market experiences, over coffee, at lunch or at our evening reception. We are certainly proud to be a part of such an enthusiastic community.

Full or half day workshop on day 1.

We are running a 1-day series of workshops to kick off EARL on 6th September, covering all areas of R from explainable machine learning, to time series visualisation, functional programming with purr, an introduction to plumber APIs to having some fun and making games in Shiny. There is plenty of choice with morning and afternoon sessions agenda.

Full conference pass.

Our all-access pass to EARL gives you full access to a 1-day workshop, full 2-day conference pass and access to the evening reception at the unforgettable Drapers Hall on day 2 – the former home of Henry VIII. We have got an impressive line-up of keynotes including mathematician, science presenter and all-round badass – Hannah Fry, Top 100 Global Innovator in Data & Analytics – Harry Powell and the unmissable Financial Times columnist John Burn-Murdock. To add to this excitement, we have approved used cases from Bumble, Samaritans, BBC, Meta, Bank of England, Dogs Trust, NHS, and partners RStudio alongside many more.

1 or 2-day conference pass.

If you would like access to the keynotes, session talks and abundance of networking opportunities, you can choose from a 1 or 2-day pass aligned to your areas of interest. The 2-day conference pass gives you access to the main evening reception.

Evening reception.

This year we have opted for an unforgettable experience at Drapers Hall (the former home of Henry VIII), where you will get the ability to network with colleagues, delegates and speakers over drinks, canapes, and dinner in unforgettable surroundings. Transport is provided in a provide London red bus transfer. This year promises an unforgettable experience, with a heavy weight line up, use cases from leading brands and the opportunity at last to share and network to your heart’s content. We look forward to meeting you. Book your tickets now.

Detecting multicollinearity — it’s not that easy sometimes

By Huey Fern Tay with Greg Page

When are two variables too related to one another to be used together in a linear regression model? Should the maximum acceptable correlation be 0.7? Or should the rule of thumb be 0.8? There is actually no single, ‘one-size-fits-all’ answer to this question.

As an alternative to using pairwise correlations, an analyst can examine the variance inflation factor, or VIF, associated with each of the numeric input variables. Sometimes, however, pairwise correlations, and even VIF scores, do not tell the entire picture.

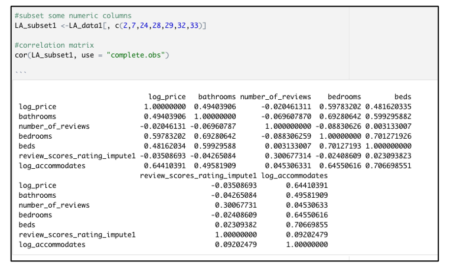
Consider this correlation matrix created from a Los Angeles Airbnb dataset.


Two item pairs identified in the correlation matrix above have a strong correlation value:

· Beds + log_accommodates (r= 0.701)

· Beds + bedrooms (r= 0.706)

Based on one school of thought, these correlation values are cause for concern; meanwhile, other sources suggest that such values are nothing to be worried about.

The variance inflation factor, which is used to detect the severity of multicollinearity, does not suggest anything unusual either.

library(car)
vif(model_test) 

The VIF for each potential input variable is found by making a separate linear regression model, in which the variable being scored serves as the outcome, and the other numeric variables are the predictors. The VIF score for each variable is found by applying this formula:


When the other numeric inputs explain a large percentage of the variability in some other variable, then that variable will have a high VIF. Some sources will tell you that any VIF above 5 means that a variable should not be used in a model, whereas other sources will say that VIF values below 10 are acceptable. None of the vif() results here appear to be problematic, based on standard cutoff thresholds.

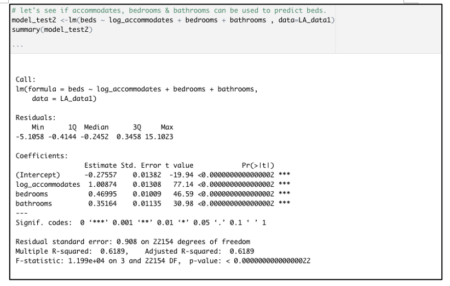
Based on the vif() results shown above, plus some algebraic manipulation of the VIF formula, we can know that a model that predicts beds as the outcome variable, using log_accommodates, bedrooms, and bathrooms as the inputs, has an r-squared of just a little higher than 0.61. That is verified with the model shown below:


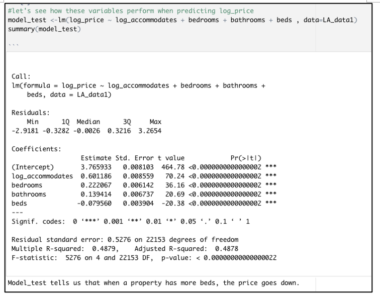
But look at what happens when we build a multi-linear regression model predicting the price of an Airbnb property listing.


The model summary hints at a problem because the coefficient for beds is negative. The proper interpretation for each coefficient in this linear model is the way that log_price will be impacted by a one-unit increase in that input, with all other inputs held constant.

Literally, then, this output indicates that having more beds within a house or apartment will make its rental value go down, when all else is held constant. That not only defies our common sense, but it also contradicts something that we already know to be the case — that bed number and log_price are positively associated. Indeed, the correlation matrix shown above indicates a moderately-strong linear relationship between these values, of 0.4816.

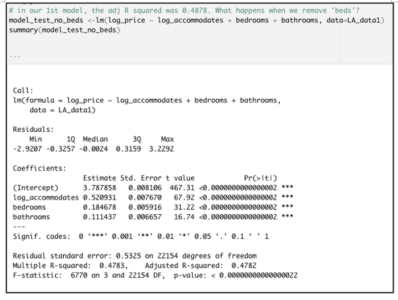
After dropping ‘beds’ from the original model, the adjusted R-squared declines only marginally, from 0.4878 to 0.4782.


This tiny decline in adjusted r-squared is not worrisome at all. The very low p-value associated with this model’s F-statistic indicates a highly significant overall model. Moreover, the signs of the coefficients for each of these inputs are consistent with the directionality that we see in the original correlation matrix.

Moreover, we still need to include other important variables that determine real estate pricing e.g. location and property type. After factoring in these categories along with other considerations such as pool availability, cleaning fee, and pet-friendly options, the model’s adjusted R-squared value is pushed to 0.6694. In addition, the residual standard error declines from 0.5276 in the original model to 0.4239.

Long story short: we cannot be completely reliant on rules of thumb, or even cutoff thresholds from textbooks, when evaluating the multicollinearity risk associated with specific numeric inputs. We must also examine model coefficients’ signs. When a coefficient’s sign “flips” from the direction that we should expect, based on that variable’s correlation with the response variable, that can also indicate that our model coefficients are impacted by multicollinearity.

Data source: Inside Airbnb

Download recently published book – Learn Data Science with R

Learn Data Science with R is for learning the R language and data science. The book is beginner-friendly and easy to follow. It is available for download as pay what you want. The minimum price is 0 and the suggested contribution is rs 1300 ($18). Please review the book at Goodreads.

book cover

The book topics are –
  • R Language
  • Data Wrangling with data.table package
  • Graphing with ggplot2 package
  • Exploratory Data Analysis
  • Machine Learning with caret package
  • Boosting with lightGBM package
  • Hands-on projects

New R textbook for machine learning

Mathematics and Programming for Machine Learning with R -Chapter 2 Logic

Have a look at the FREE attached pdf of Chapter 2 on Logic and R from my recently published textbook,

Mathematics and Programming for Machine Learning with R: From the Ground Up, by William B. Claster (Author)
~430 pages, over 400 exercises.Mathematics and Programming for Machine Learning with R -Chapter 2 Logic
We discuss how to code machine learning algorithms in R but start from scratch. The first 4 chapters cover Logic, Sets, Probability, Functions. I am sharing Chapter 2 here on Logic and R here and will also probably release chapters 9 and 10 on Math for Neural Networks shortly. The text is on sale at Amazon here:
https://www.amazon.com/Mathematics-Programming-Machine-Learning-R-dp-0367507854/dp/0367507854/ref=mt_other?_encoding=UTF8&me=&qid=1623663440

I will try to add an errata page as well.

Tutorial: Cleaning and filtering data from Qualtrics surveys, and creating new variables from existing data

Hi fellow R users (and Qualtrics users),

As many Qualtrics surveys produce really similar output datasets, I created a tutorial with the most common steps to clean and filter data from datasets directly downloaded from Qualtrics.

You will also find some useful codes to handle data such as creating new variables in the dataframe from existing variables with functions and logical operators.

The tutorial is presented in the format of a downloadable R code with  explanations and annotations of each step. You will also find a raw Qualtrics dataset to work with.

Link to the tutorial: https://github.com/angelajw/QualtricsDataCleaning

This dataset comes from a Qualtrics survey with an experiment format (control and treatment conditions), but the codes can be applicable to non-experimental datasets as well, as many cleaning steps are the same.