Ebook launch – Simple Data Science (R)

Simple Data Science (R) covers the fundamentals of data science and machine learning. The book is beginner-friendly and has detailed code examples. It is available at scribd.

cover image

Topics covered in the book –
  • Data science introduction
  • Basic statistics
  • Graphing with ggplot2 package
  • Exploratory Data Analysis
  • Machine Learning with caret package
  • Regression, classification, and clustering
  • Boosting with lightGBM package
  • Hands-on projects
  • Data science use cases

Classification modeling in R for profitable decisions workshop

Learn classification modeling to improve your decision-making for your business or use these skills for your research in our 2-part workshop! These workshops are a part of our workshops for Ukraine series, and all proceeds from these workshops go to support Ukraine. You can find more information about other workshops, as well as purchase recordings of the previous workshops here.

In the first part of the workshop titled Classification modeling for profitable decisions, which will take place online on Thursday, October 20th, 18:00 – 20:00 CET, we will cover the theoretical framework that you need to know to perform classification analysis and cover the key concepts. 

The second part of the workshop that will take place on Thursday, October 27th, 18:00 – 20:00 CET will include hands-on practice in R, so that you can learn how to implement the concepts covered in the first part in R. 

You can register for each part separately, so you can choose whether you wish to attend both parts or just part 1 or part 2.   Below you can find more information about each part and how to register for it: 

PART 1
Title: Classification modeling for profitable decisions: Theory and a case study on firm defaults. 
Date:
Thursday, October 20th, 18:00 – 20:00 CET (Rome, Berlin, Paris timezone)
Speaker:
Gábor Békés is an Assistant Professor at the Department of Economics and Business of Central European University, a research fellow at KRTK in Hungary, and a research affiliate at CEPR. His research is focused on international economics; economic geography and applied IO, and was published among others by the Global Strategy Journal, Journal of International Economics, Regional Science and Urban Economics or Economic Policy and have authored commentary on VOXEU.org. His comprehensive textbook, Data Analysis for Business, Economics, and Policy with Gábor Kézdi was publsihed by Cambridge University Press in 2021. 
Description:
This workshop will introduce the framework and methods of probability prediction and classification analysis for binary target variable. We will discuss the key concepts such as probability prediction, classification threshold, loss function, classification, confusion table, expected loss, the ROC curve, AUC and more. We will use logit models as well as random forest to predict probabilities and classify. In the workshop we will focus on a case study on firm defaults using a dataset on financial and management features of firms. The workshop material is based on a chapter and a case study from my textbook. Code in R and Python are available from the Github repo, and the data is available as well. The workshop will introduce key concepts, but the focus will be on data wrangling and modelling decisions we make for a real life problem. There will be a follow-up workshop focusing on the coding side of the case study. 
Minimal registration fee:
20 euro (or 20 USD or 750 UAH)
Suggested registration fee for professionals:
50 euro (if you can afford it, our suggested registration fee for this workshop is 50 euro. If you cannot afford it, you can still register by donating 20 euro).

Remember that you can register even if you will not be able to attend in person as all registered participants will get a recording.

How can I register?
  • Go to https://bit.ly/3wvwMA6 or https://bit.ly/3PFxtNA and donate at least 20 euro. Feel free to donate more if you can, all proceeds go to support Ukraine!
  • Save your donation receipt (after the donation is processed, there is an option to enter your email address on the website to which the donation receipt is sent)
  • Fill in the registration form, attaching a screenshot of a donation receipt (please attach the screenshot of the donation receipt that was emailed to you rather than the page you see after donation).

If you are not personally interested in attending, you can also contribute by sponsoring a participation of a student, who will then be able to participate for free. If you choose to sponsor a student, all proceeds will also go directly to organisations working in Ukraine. You can either sponsor a particular student or you can leave it up to us so that we can allocate the sponsored place to students who have signed up for the waiting list.

How can I sponsor a student?
  • Go to https://bit.ly/3wvwMA6 or https://bit.ly/3PFxtNA and donate at least 20 euro (or 17 GBP or 23 USD or 660 UAH). Feel free to donate more if you can, all proceeds go to support Ukraine!
  • Save your donation receipt (after the donation is processed, there is an option to enter your email address on the website to which the donation receipt is sent)
  • Fill in the sponsorship form, attaching the screenshot of the donation receipt (please attach the screenshot of the donation receipt that was emailed to you rather than the page you see after the donation). You can indicate whether you want to sponsor a particular student or we can allocate this spot ourselves to the students from the waiting list. You can also indicate whether you prefer us to prioritize students from developing countries when assigning place(s) that you sponsored.

If you are a university student and cannot afford the registration fee, you can also sign up for the waiting list here. (Note that you are not guaranteed to participate by signing up for the waiting list).


PART 2
Title: Classification modelling for profitable decisions: Hands on practice in R
Date:
Thursday, October 27th, 18:00 – 20:00 CET (Rome, Berlin, Paris timezone)
Speaker:
Ágoston Reguly is a Postdoctoral Fellow at the Financial Services and Innovation Lab of Scheller College of Business, Georgia Institute of Technology. His research is focused on causal machine learning methods and their application in corporate finance. He obtained his Ph.D. degree from Central European University (CEU), where he has taught multiple courses such as data analysis, coding, and mathematics. Before CEU he worked for more than three years at the Hungarian Government Debt Management Agency.
Description:
This workshop will implement methods of probability prediction and classification analysis for the binary target variable. This workshop is a follow-up to Gábor Békés’s workshop on the key concepts and (theoretical) methods for the same subject. We will use R via RStudio to apply probability prediction, classification threshold, loss function, classification, confusion table, expected loss, the ROC curve, AUC, and more. We will use linear probability models, logit models as well as random forests to predict probabilities and classify. In the workshop, we follow the case study on firm defaults using a dataset on financial and management features of firms. The workshop material is based on a chapter and a case study from the textbook of Gábor Békés and Gábor Kézdi (2021): Data Analysis for Business, Economics, and Policy, Cambridge University Press. The workshop will not only implement the key concepts, but the focus will be on data wrangling and modeling decisions we make for a real-life problem. Minimal registration fee: 20 euro (or 20 USD or 750 UAH) Suggested registration fee for professionals: 50 euro (if you can afford it, our suggested registration fee for this workshop is 50 euro. If you cannot afford it, you can still register by donating 20 euro).

How can I register?
  • Go to https://bit.ly/3wvwMA6 or https://bit.ly/3PFxtNA and donate at least 20 euro. Feel free to donate more if you can, all proceeds go to support Ukraine!
  • Save your donation receipt (after the donation is processed, there is an option to enter your email address on the website to which the donation receipt is sent)
  • Fill in the registration form, attaching a screenshot of a donation receipt (please attach the screenshot of the donation receipt that was emailed to you rather than the page you see after donation).

How can I sponsor a student?
  • Go to https://bit.ly/3wvwMA6 or https://bit.ly/3PFxtNA and donate at least 20 euro (or 17 GBP or 23 USD or 660 UAH). Feel free to donate more if you can, all proceeds go to support Ukraine!
  • Save your donation receipt (after the donation is processed, there is an option to enter your email address on the website to which the donation receipt is sent)
  • Fill in the sponsorship form, attaching the screenshot of the donation receipt (please attach the screenshot of the donation receipt that was emailed to you rather than the page you see after the donation). You can indicate whether you want to sponsor a particular student or we can allocate this spot ourselves to the students from the waiting list. You can also indicate whether you prefer us to prioritize students from developing countries when assigning place(s) that you sponsored.

If you are a university student and cannot afford the registration fee, you can also sign up for the waiting list here. (Note that you are not guaranteed to participate by signing up for the waiting list).

Looking forward to seeing you during the workshop!

Time to upskill in R? EARL’s workshop lineup has something for every data practitioner.

It’s well-documented that data skills are in high demand, making the industry even more competitive for employers looking for experienced data analysts, data scientists and data engineers – the fastest-growing job roles in the UK. In support of this demand, it’s great to see the government taking action to address the data skills gap as detailed in their newly launched Digital Strategy.

The range of workshops available at EARL 2022 is designed to help data practitioners extend their skills via a series of practical challenges. Led by specialists in Shiny, Purrr, Plumber, ML and time series visualisation, you’ll leave with tips and skills you can immediately apply to your commercial scenarios.

The EARL workshop lineup.


Time Series Visualisation in R.

How does time affect our perception of data? Is the timescale important? Is the direction of time relevant? Sometimes cumulative effects are not visible with traditional statistical methods, because smaller increments stay under the radar. When a time component is present, it’s likely that the current state of our problem depends on the previous states. With time series visualisations we can capture changes that may otherwise go undetected. Find out more.

Explainable Machine Learning.

Explaining how your ML products make decisions empowers people on the receiving end to question and appeal these decisions. Explainable AI is one of the many tools you need to ensure you’re using ML responsibly. AI and, more broadly, data can be a dangerous accelerator of discrimination and biases: skin diseases were found to be less effectively diagnosed on black skin by AI-powered software, and search engines advertised lower-paid jobs to women. Staying away from it might sound like a safer choice, but this would mean missing out on the huge potential it offers. Find out more.

Introduction to Plumber APIs.

90% of ML models don’t make it into production. With API building skills in your DS toolbox, you should be able to beat this statistic in your own projects. As the field of data science matures, much emphasis is placed on moving beyond scripts and notebooks and into software development and deployment. Plumber is an excellent tool to make the results from your R scripts available on the web. Find out more.

Functional Programming with Purrr.

Iteration is a very common task in Data Science. A loop in R programming is of course one option – but purrr (a package from the tidyverse) allows you to tackle iteration in a functional way, leading to cleaner and more readable code. Find out more.

How to Make a Game with Shiny.

Shiny is only meant to be used to develop dashboards, right? Or is it possible to develop more complex applications with Shiny? What would be the main limitations? Could R and Shiny be used as a general-purpose framework to develop web applications? Find out more.

Sound interesting? Check out the full details – our workshops spaces traditionally go fast so get yourself and your team booked in while there are still seats available. Book your Workshop Day Pass tickets now.

55,000 in Awards for Energy & Buildings Hackathon, Sponsored by NYSERDA

The New York State Energy Research & Development Agency (NYSERDA) is partnering with Onboard Data to host a $55,000 Global Energy & Buildings Hackathon. We’re inviting all engineers, data scientists and software developers whether they are professionals, professors, researchers or students to participate. More below…


Challenge participants will propose exciting, new ideas that can improve our world’s buildings. The hackathon will share data from 200+ buildings to participants. This data set is rich and one of a kind. The data set is normalized from equipment, systems and IoT devices found within buildings.
We seek submissions that positively impact or accelerate the decarbonization of New York State buildings. 

Total awards are $55,000. Sign-ups stay open until April 15th and the competition is open from April 22nd to May 30th. More can be found here: www.rtemhackathon.com.

Advance the next generation of building technology!

Create a hyper-marketing model using Naïve Bayes

By Huey Fern Tay with Greg Page

Everyone loves an extra income stream – even the super-wealthy owners of luxurious properties that they only inhabit for just a few weeks each year.  Offering a property as a short-term rental through a platform like Airbnb can provide a wonderful side hustle.  For some owners, however, the associated hassles could be a powerful deterrent to using the service.  Text messages at 3 a.m. about Wi-Fi passwords, stopped-up toilets, and the lack of water pressure in the shower might be just enough to tip the scales against such an undertaking…especially when such messages are followed up by angry “Why isn’t this fixed yet?” queries just 30 minutes later.

So what if an all-in-one concierge service could take away ALL of those hassles?  If an intermediary service could handle all of the tenant interactions, the marketing, the logistics of the key hand-offs, etc. then suddenly the idle rich jetsetters might be a bit more willing to open up their pied-a-terres to the unbathed masses.  Such a service would benefit all stakeholders – travelers would have more options, the property owners would earn more income, and the platform would receive more commission fees from the extra transactions. In exchange for a fee paid to the service, willing property owners could have a side hustle that was “all side, no hustle.”  

Let’s imagine that such a service is looking to establish itself, with an initial marketing outreach effort to high-end property owners not already using Airbnb.  Let’s also imagine that this new service is operating on a shoestring budget, and therefore needs to. How can it identify the properties within a city that are most likely to command high values in the short-term rental market? 

The Naïve Bayes classifier is a good candidate for the task at hand because of its simplicity, computational efficiency, and ability to handle categorical variables.  Furthermore, its classification outcomes come with associated probability values – we can use those to identify records that are most likely to belong to some particular group. 

To illustrate how this method could be used to solve the business problem outlined above, I will utilize Airbnb data of San Francisco listings.

One of the first decisions the modeler must make is deciding how to bin the data. In this case, the question is which numerical variable would you use to separate the properties? Would you use price, review ratings, or number of reviews? Each of these variables has a different impact on the outcome and may not be equally effective at separating classes. If the classes are not well separated, then even a large dataset will not be helpful.

The next important decision is to determine the number of classification categories you would like to create. Also, what would the cut-off be for each group? In other words, should you create four groups and bin them equally? Or should you create three groups by dividing the data according to a 15-70-15 proportion, 20-40-20, or 30-40-30…etc? The decision made at this step has a big impact on the model.

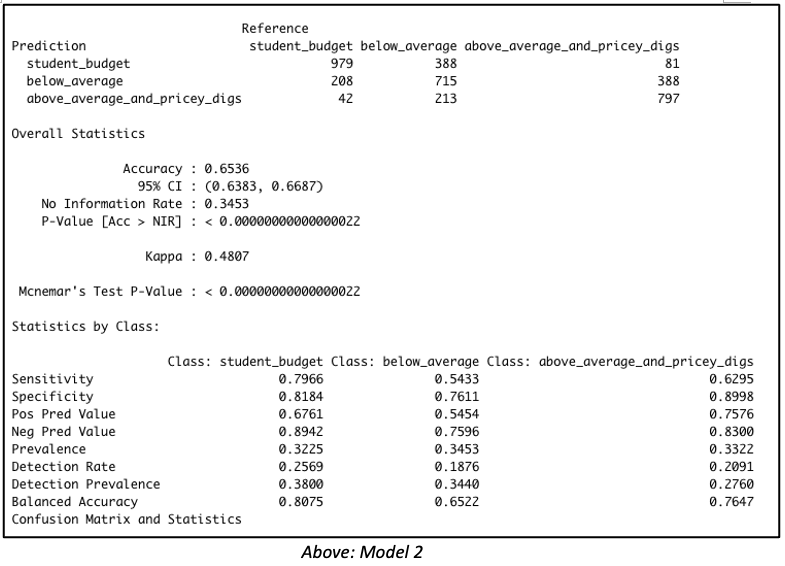
Consider both models below which were each created with 3811 rows of data representing 60% of the total dataset. Both models were created with the same predictor variables, such as the number of bedrooms, bathrooms, property type, location, etc. But in Model 1, the data was binned into 4 equal groups while in Model 2, the data was binned into 3 equal groups. The model summary for Model 1 showed the model has an accuracy of 54.19%, which is good considering that this performance is slightly more than double the No Information Rate (Naïve Rate). Model 2’s accuracy’s level is at 65.36%, a level which is nearly double its No Information Rate.

These are encouraging results but in our Airbnb example, we are more interested in knowing how well our model performs when it is asked to classify properties into any of the classes used in the model. For this reason, it is worth considering the true positive rate i.e. ‘sensitivity’. Model 1 is better at predicting the true positives (‘sensitivity’) for classes at opposite ends of the spectrum. This suggests Model 1 has difficulty reading nuances. On the other hand, Model 2’s performance in this regard is comparatively more balanced.
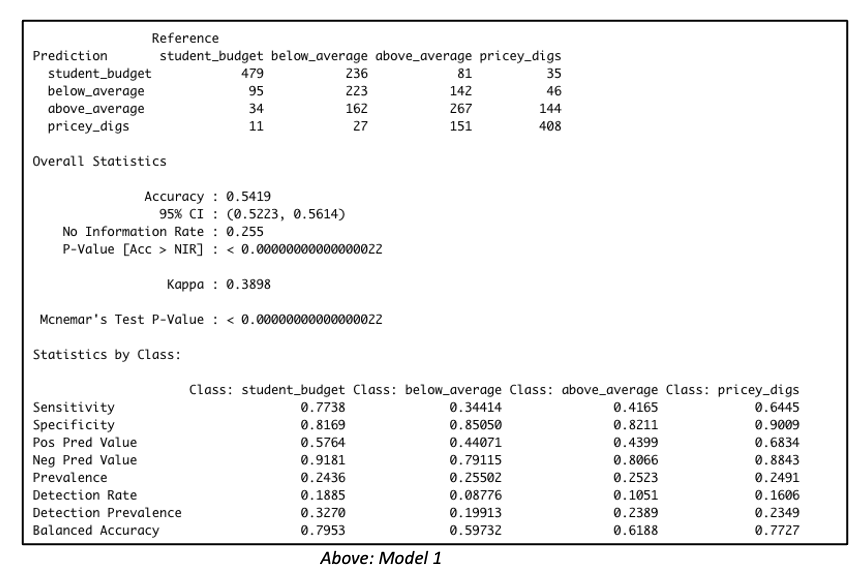
Naive Bayes model with four classification outcome


Naive Bayes output with three classification outcome


But wait – let’s get back to our original goal.  While overall accuracy is good to see, what we are most interested in here is identifying that high-end price group.  Owners of such units will be the best targets for our all-in-one concierge service.  Therefore, let’s dive a bit deeper to examine this model’s suitability for identifying such properties. 

By running the predict() function with the type=’raw’ parameter included, we can view the associated probabilities for each outcome class, and then rank records by probability of belonging to some particular outcome group. 

Taking this approach with the validation set, we find that among the 100 records identified by the model as most likely to land in the top tier group, 96 truly belonged to “Above Average and Pricey Digs.”   Among the 150 likeliest, 140 units, or 93.33%, actually belonged to that group, and among the 200 likeliest, 185 units, or 92.5%, were truly in that top tier. 

But that’s not all. It is worth going one step further by evaluating the model with lift charts or decile-wise lift charts because these charts determine how effectively our model ‘skims the cream’.

The decile-wise lift charts below illustrate how effectively the model can predict membership in the ‘above average and pricey digs’ group. When the model is used to classify the top 27% properties in this category, its performance is more than 3.5x better than a random guess.
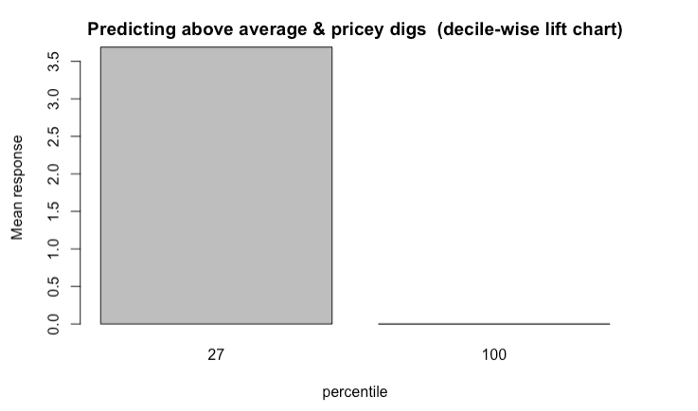
Decile-wise lift chart shows the model is 3.5 times better at classifying the top 27 percent properties

Another way to assess the model’s ability to identify top-tier rentals is with a two-dimensional lift chart.  Such a chart only works with two-outcome class scenarios, so we start here by collapsing the first and second tiers together, and then labelling that group as “other.”  
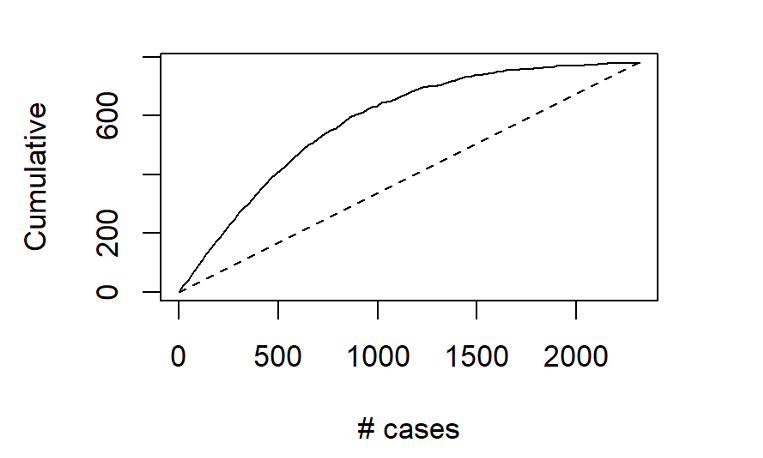
Gains chart shows among the 500 records that the model says are most likely to land in the Above Average & Pricey Digs Tier, just over 400 truly did belong to that group

In the entire validation set, there are 780 units that land in the highest price tier.  The values along the x-axis represent all the validation set records, ranked in order of their probability of belonging to the highest-tier class.  The y-axis shows the number of correct predictions.  The solid line represents the model’s performance – it shows us, for instance, that among the 500 records that the model says are most likely to land in the Above Average & Pricey Digs Tier, just over 400 truly did belong to that group.  The line flattens out at around x=1500, because by that point, the model has already identified nearly all of the records that truly belonged to this outcome class. 

The dotted line, by contrast, shows how effective a model would be if it simply labelled all the records as belonging to the top tier.  Since 33.6%, of the validation records belong to this group, each x-axis value here corresponds to a y-axis value that is exactly 33.6% as large.  The difference between the solid line and the dotted line represents the model’s improvement as the number of cases increases.

What do these results mean for the concierge service?  Let’s revisit our original assumptions: 


  • such a service would most likely appeal to the owners of properties in the highest pricing tier;
  • the initial outreach efforts should be made to owners of properties not already registered with Airbnb; and that
  • the new service has a limited budget, and therefore needs to carefully focus its outreach efforts only on that tier of properties whose owners would be likeliest to use it
Given these assumptions, our primary interest does not lie with overall model accuracy.  The model’s ability to distinguish between the bottom two pricing tiers is almost immaterial to us; however, we are keenly interested in the answer to this question:  When the model predicts that a property will belong to the highest pricing tier, how often is it correct? 

As demonstrated here, the model delivers quite effectively in this regard, especially when we maintain a relatively narrow focus on the properties that are most likely to be top tier.  Splashy magazine inserts, Super Bowl advertisements, and big-ticket endorsements from celebrities might be in the cards for this service down the road, after it spreads across the globe and prepares for its IPO roadshow.  For now, though, the hyper-specific focus that can come from “skimming the cream” off the top of those Naïve Bayes model probability predictions may be the surest next step for this service’s success. 

Data source: Inside Airbnb
 

Download recently published book – Learn Data Science with R

Learn Data Science with R is for learning the R language and data science. The book is beginner-friendly and easy to follow. It is available for download as pay what you want. The minimum price is 0 and the suggested contribution is rs 1300 ($18). Please review the book at Goodreads.

book cover

The book topics are –
  • R Language
  • Data Wrangling with data.table package
  • Graphing with ggplot2 package
  • Exploratory Data Analysis
  • Machine Learning with caret package
  • Boosting with lightGBM package
  • Hands-on projects

New R textbook for machine learning

Mathematics and Programming for Machine Learning with R -Chapter 2 Logic

Have a look at the FREE attached pdf of Chapter 2 on Logic and R from my recently published textbook,

Mathematics and Programming for Machine Learning with R: From the Ground Up, by William B. Claster (Author)
~430 pages, over 400 exercises.Mathematics and Programming for Machine Learning with R -Chapter 2 Logic
We discuss how to code machine learning algorithms in R but start from scratch. The first 4 chapters cover Logic, Sets, Probability, Functions. I am sharing Chapter 2 here on Logic and R here and will also probably release chapters 9 and 10 on Math for Neural Networks shortly. The text is on sale at Amazon here:
https://www.amazon.com/Mathematics-Programming-Machine-Learning-R-dp-0367507854/dp/0367507854/ref=mt_other?_encoding=UTF8&me=&qid=1623663440

I will try to add an errata page as well.

Climate Change & AI for GOOD | Online Open Forum Oct 15th

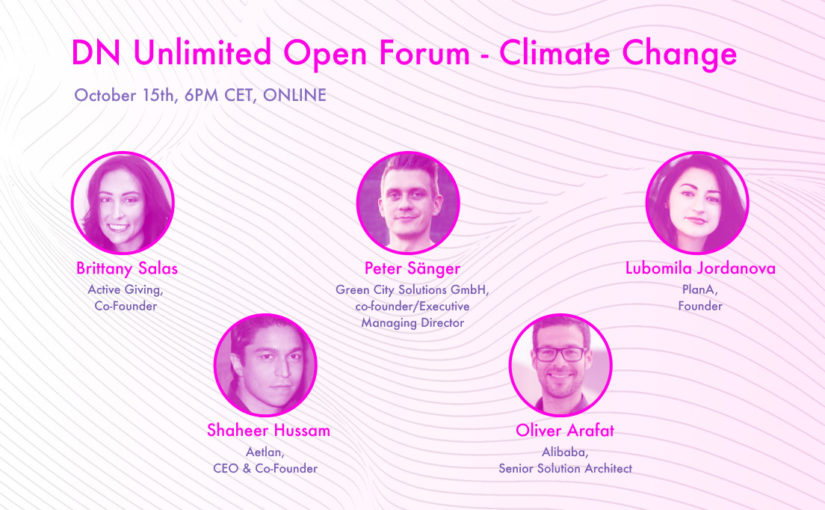
Join Data Natives for a discussion on how to curb Climate Change and better protect our environment for the next generation. Get inspired by innovative solutions which use data, machine learning and AI technologies for GOOD. Lubomila Jordanova, Founder of Plan A, and featured speaker, explains that “the IT sector will use up to 51% of the global energy output in 2030. Let’s adjust the digital industry and use Data for Climate Action, because carbon reduction is key to making companies future-proof.” When used carefully, AI can help us solve some of the most serious challenges. However, key to that success is measuring impact with the right methods, mindsets, and metrics.

The founders of startups that developed innovative solutions to combat humanity’s biggest challenge, will share their experiences and thoughts: Brittany Salas (Co-Founder at Active Giving) Peter Sänger (Co-Founder/Executive Managing Director at Green City Solutions GmbH) Shaheer Hussam (CEO & Co-Founder at Aetlan) | Lubomila Jordanova (Founder at Plan A)  Oliver Arafat (Alibaba Cloud’s Senior Solution Architect)

Details
What? Climate Change & AI for GOOD | DN Unlimited Open Forum powered by Alibaba Cloud
When? October 15th at 6 PM CET
Where? Online, worldwide
Register for FREE here: https://datanatives.io/climate-change-ai-for-good-open-forum/

Does imputing model labels using the model predictions can improve it’s performance?

In some scenarios a data scientist may want to train a model for which there exists an abundance of observations, but only a small fraction of is labeled, making the sample size available to train the model rather small. Although there’s plenty of literature on the subject (e.g. “Active learning”, “Semi-supervised learning” etc) one may be tempted (maybe due to fast approaching deadlines) to train a model with the labelled data and use it to impute the missing labels.

While for some the above suggestion might seem simply incorrect, I have encountered such suggestions on several occasions and had a hard time refuting them. To make sure it wasn’t just the type of places I work at I went and asked around in 2 Israeli (sorry non Hebrew readers) machine learning oriented Facebook groups about their opinion: Machine & Deep learning Israel and Statistics and probability group. While many were referring me to methods discussed in the literature, almost no one indicated the proposed method was utterly wrong. I decided to perform a simulation study to get a definitive answer once and for all. If you’re interested in reading what were the results see my analysis on Github.

Lyric Analysis with NLP and Machine Learning using R: Part One – Text Mining

June 22
By Debbie Liske

This is Part One of a three part tutorial series originally published on the DataCamp online learning platform in which you will use R to perform a variety of analytic tasks on a case study of musical lyrics by the legendary artist, Prince. The three tutorials cover the following:


Musical lyrics may represent an artist’s perspective, but popular songs reveal what society wants to hear. Lyric analysis is no easy task. Because it is often structured so differently than prose, it requires caution with assumptions and a uniquely discriminant choice of analytic techniques. Musical lyrics permeate our lives and influence our thoughts with subtle ubiquity. The concept of Predictive Lyrics is beginning to buzz and is more prevalent as a subject of research papers and graduate theses. This case study will just touch on a few pieces of this emerging subject.


Prince: The Artist

To celebrate the inspiring and diverse body of work left behind by Prince, you will explore the sometimes obvious, but often hidden, messages in his lyrics. However, you don’t have to like Prince’s music to appreciate the influence he had on the development of many genres globally. Rolling Stone magazine listed Prince as the 18th best songwriter of all time, just behind the likes of Bob Dylan, John Lennon, Paul Simon, Joni Mitchell and Stevie Wonder. Lyric analysis is slowly finding its way into data science communities as the possibility of predicting “Hit Songs” approaches reality.

Prince was a man bursting with music – a wildly prolific songwriter, a virtuoso on guitars, keyboards and drums and a master architect of funk, rock, R&B and pop, even as his music defied genres. – Jon Pareles (NY Times)
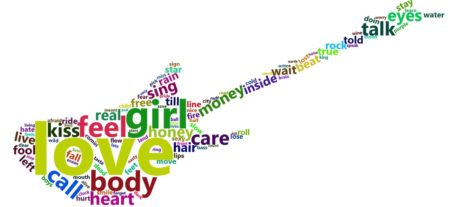
In this tutorial, Part One of the series, you’ll utilize text mining techniques on a set of lyrics using the tidy text framework. Tidy datasets have a specific structure in which each variable is a column, each observation is a row, and each type of observational unit is a table. After cleaning and conditioning the dataset, you will create descriptive statistics and exploratory visualizations while looking at different aspects of Prince’s lyrics.

Check out the article here!


(reprint by permission of DataCamp online learning platform)