Data visualization and charting are actively evolving as a more and more important field of web development. In fact, people perceive information much better when it is represented graphically rather than numerically as raw data. As a result, various business intelligence apps, reports, and so on widely implement graphs and charts to visualize and clarify data and, consequently, to speed up and facilitate its analysis for further decision making.
While there are many ways you can follow to handle data visualization in R, today let’s see how to create interactive charts with the help of popular JavaScript (HTML5) charting library
AnyChart. It has
recently got an official
R, Shiny and MySQL template that makes the whole process pretty straightforward and easy. (
Disclaimer: I am the CTO at the AnyChart team. The template I am talking about here is released under the Apache 2.0 license; the library itself can be used for free in any personal, educational and other non-profit projects and is
open on GitHub, but for commercial purposes it requires a
commercial license though is fully functional when
taken on a free trial.)
In this step-by-step tutorial, we will take a closer look at the template and the basic pie chart example it includes, and then I will show you how to quickly modify it to get some different data visualization, e.g. a 3D column (vertical bar) chart.
Briefly about AnyChart
AnyChart is a flexible, cross-browser JS charting library for adding interactive charts to websites and web apps in quite a simple way. Basically, it does not require any installations and work with any platform and database. Some more of AnyChart’s features include (but are not limited to):
Templates for popular technology stacks, like R, Shiny and MySQL in the present case, can further facilitate AnyChart’s integration.
Getting started
First of all, let’s make sure the R language is installed. If not, you can visit the
official R website and follow the instructions.
If you have worked with R before, most likely you already have RStudio. Then you are welcome to create a project in it now, because the part devoted to R can be done there. If currently you do not have RStudio, you are welcome to install it from the
official RStudio website. But, actually, using RStudio is not mandatory, and the pad will be enough in our case.
After that, we should check if MySQL is properly installed. To do that, you can open a terminal window and enter the next command:
$ mysql –version
mysql Ver 14.14 Distrib 5.7.16, for Linux (x86_64) using EditLine wrapper
You should receive the above written response (or a similar one) to be sure all is well. Please follow
these instructions to install MySQL, if you do not have it at the moment.
Now that all the required components have been installed, we are ready to write some code for our example.
Basic template
First, to download the R, Shiny and MySQL template for AnyChart, type the next command in the terminal:
$ git clone https://github.com/anychart-integrations/r-shiny-mysql-template.git
The folder you are getting here features the following structure:
r-shiny-mysql-template/
www/
css/
style.css # css style
app.R # main application code
database_backup.sql # MySQL database dump
LICENSE
README.md
index.html # html template
Let’s take a look at the project files and examine how this sample works. We’ll run the example first.
Open the terminal and go to the repository folder:
$ cd r-shiny-mysql-template
Set up the MySQL database. To specify your username and password, make use of
-u and
-p flags:
$ mysql < database_backup.sql
Then run the R command line, using the command below:
$ R
And install the Shiny and RMySQL packages as well as initialize the Shiny library at the end:
> install.packages("shiny")
> install.packages("RMySQL")
> library(shiny)
If you face any problems during the installation of these dependencies, carefully read error messages, e.g. you might need
sudo apt-get install libmysqlclient-dev for installing RMySQL.
Finally, run the application:
> runApp("{PATH_TO_TEMPLATE}") # e.g. runApp("/workspace/r-shiny-mysql-template")
And the new tab that should have just opened in your browser shows you the example included in the template:
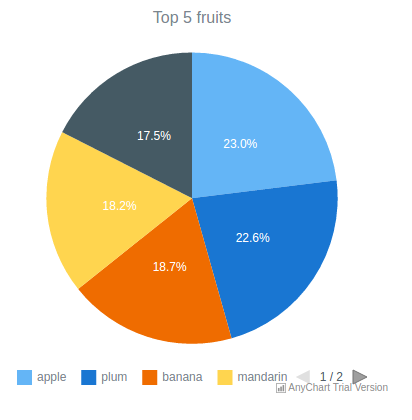
Basic template: code
Now, let’s go back to the folder with our template to see how it works.
Files
LICENSE and
README.md contain information about the license and the template (how to run it, technologies, structure, etc.) respectively. They are not functionally important to our project, and therefore we will not explore them here. Please check these files by yourself for a general understanding.
The
style.css file is responsible for the styles of the page.
The
database_backup.sql file contains a code for the MySQL table and user creation and for writing data to the table. You can use your own table or change the data in this one.
Let’s move on to the code. First, open the
app.R file. This file ensures the connection to the MySQL database, reads data, and passes it to the
index.html file, which contains the main code of using AnyChart. The following is a part of the
app.R code, which contains the
htmlTemplate function; here we specify the name of the file where the data will be transmitted to, the names of our page and chart, and the JSON encoded chart data from MySQL database.
htmlTemplate("index.html",
title = "Anychart R Shiny template",
chartTitle = shQuote("Top 5 fruits"),
chartData = toJSON(loadData())
The main thing here is the
index.html file, which is actually where the template for creating charts is. As you see, the first part of this file simply connects all necessary files to the code, including the AnyChart library, the CSS file with styles, and so on. I’ll skip this for now and proceed directly to the
script tag and the
anychart.onDocumentReady (function () {...}) function.
[code lang=”javascript”]
anychart.onDocumentReady(function() {
var chart = anychart.pie({{ chartData }});
chart.title({{ chartTitle }});
chart.container("container");
chart.draw();
});
This pattern works as follows. We create a pie chart by using the function
pie() and get the data that have already been read and prepared using the R code. Please note that the names of the variables containing data are the same in the
app.R and
index.html files. Then we display the chart title via (
chart.title({{ chartTitle }})) and specify the ID of the element that will contain a chart, which is a div with
id = container in this case. To show all that was coded, we use
сhart.draw().
Modifying the template to create a custom chart
Now that we’ve explored the basic example included in the template, we can move forward and create our own, custom interactive chart. To do that, we simply need to change the template a little bit and add some features if needed. Let’s see how it works.
First, we create all the necessary files by ourselves or make a new project using RStudio.
Second, we add a project folder named
anychart. Its structure should look like illustrated below. Please note that some difference is possible (and acceptable) if you are using a new project in RStudio.
anychart/
www/
css/
style.css # css style
ui.R # main application code
server.R # sub code
database_backup.sql # data set
index.html # html template
Now you know what files you need. If you’ve made a project with the studio, the
ui.R and
server.R files are created automatically. If you’ve made a project by yourself, just create empty files with the same names and extensions as specified above.
The main difference from the original example included in the template is that we should change the file
index.html and divide
app.R into parts. You can copy the rest of the files or create new ones for your own chart.
Please take a look at the file
server.R. If you’ve made a project using the studio, it was created automatically and you don’t need to change anything in it. However, if you’ve made it by yourself, open it in the Notepad and add the code below, which is standard for the Shiny framework. You can read more about that
here.
The file structure of
ui.R is similar to the one of
app.R, so you can copy
app.R from the template and change/add the following lines:
loadData = dbGetQuery(db, "SELECT name, value FROM fruits")
data1 <- character()
#data preparation
for(var in 1:nrow(loadData)){
c = c(as.character(loadData[var, 1]), loadData[var, 2])
data1 <- c(data1, c)
}
data = matrix(data1, nrow=nrow(loadData), ncol=2, byrow=TRUE)
ui = function(){
htmlTemplate("index.html",
title = "Anychart R Shiny template",
chartTitle = shQuote("Fruits"),
chartData = toJSON(data)
)}
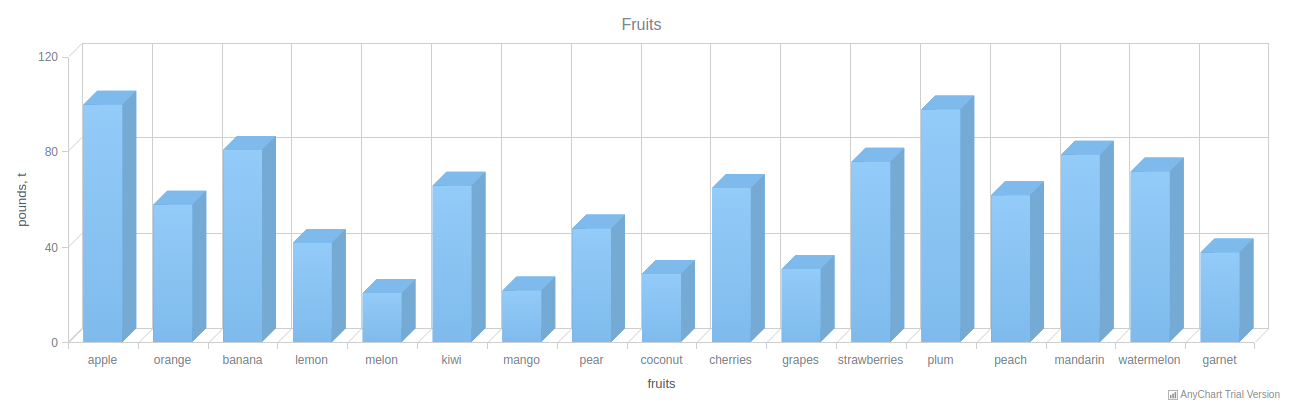
Since we are going to change the chart type, from pie to 3D vertical bar (column), the data needs some preparation before being passed to
index.html. The main difference is that we will use the entire data from the database, not simply the top 5 positions.
We will slightly modify and expand the basic template. Let’s see the resulting code of the
index.html first (the
script tag) and then explore it.
[code lang=”javascript”]
anychart.onDocumentReady(function() {
var chart = anychart.column3d({{ chartData }});
chart.title({{ chartTitle }});
chart.animation(true);
var xAxis = chart.xAxis();
xAxis.title("fruits");
var yAxis = chart.yAxis();
yAxis.title("pounds, t");
var yScale = chart.yScale();
yScale.minimum(0);
yScale.maximum(120);
chart.container("container");
chart.draw();
});
With the help of
var chart = anychart.column3d({{chartData}}), we are creating a 3D column chart by using the function
column3d(). Here you can choose any other chart type you need; consider getting help from
Chartopedia if you are unsure which one works best in your situation.
Next, we are adding animation to the column chart via
chart.animation (true) to make it appear on page load gradually.
In the following section, we are creating two variables,
xAxis and
yAxis. Including these is required if you want to provide the coordinate axes of the chart with captions. So, you should create variables that will match the captions for the X and Y axes, and then use the function, transmit the values that you want to see.
The next unit is basically optional. We are explicitly specifying the maximum and minimum values for the Y axis, or else AnyChart will independently calculate these values. You can do that the same way for the X axis.
And that’s it! Our 3D column chart is ready, and all seems to be fine for successfully running the code. The only thing left to do before that is to change the MySQL table to make it look as follows:
(‘apple’,100),
(‘orange’,58),
(‘banana’,81),
(‘lemon’,42),
(‘melon’,21),
(‘kiwi’,66),
(‘mango’,22),
(‘pear’,48),
(‘coconut’,29),
(‘cherries’,65),
(‘grapes’,31),
(‘strawberries’,76),
To see what you’ve got, follow the same steps as for running the R, Shiny and MySQL template example, but do not forget to change the path to the folder and the folder name to
anychart. So, let’s open the terminal and command the following:
$ cd anychart
$ mysql < database_backup.sql
$ R
> install.packages("shiny")
> install.packages("RMySQL")
> library(shiny)
> runApp("{PATH_TO_TEMPLATE}") # e.g. runApp("/workspace/anychart")
For consistency purposes, I am including the code of
ui.R and
server.R below. The full source code of this example can be found
on GitHub.
ui.R:
library(shiny)
library(RMySQL)
library(jsonlite)
data1 <- character()
db = dbConnect(MySQL(),
dbname = "anychart_db",
host = "localhost",
port = 3306,
user = "anychart_user",
password = "anychart_pass")
loadData = dbGetQuery(db, "SELECT name, value FROM fruits")
#data preparation
for(var in 1:nrow(loadData)){
c = c(as.character(loadData[var, 1]), loadData[var, 2])
data1 <- c(data1, c)
}
data = matrix(data1, nrow=nrow(loadData), ncol=2, byrow=TRUE)
server = function(input, output){}
ui = function(){
htmlTemplate("index.html",
title = "Anychart R Shiny template",
chartTitle = shQuote("Fruits"),
chartData = toJSON(data)
)}
shinyApp(ui = ui, server = server)
server.R:
library(shiny)
shinyServer(function(input, output) {
output$distPlot <- renderPlot({
# generate bins based on input$bins from ui.R
x <- faithful[, 2]
bins <- seq(min(x), max(x), length.out = input$bins + 1)
# draw the chart with the specified number of bins
hist(x, breaks = bins, col = ‘darkgray’, border = ‘white’)
})
})
Conclusion
When your technology stack includes R, Shiny and MySQL, using AnyChart JS with the integration template we were talking about in this tutorial requires no big effort and allows you to add beautiful interactive JavaScript-based charts to your web apps quite quickly. It is also worth mentioning that you can customize the look and feel of charts created this way as deeply as needed by using some of the library’s numerous out-of-the-box features: add or remove axis labels, change the background color and how the axis is positioned, leverage interactivity, and so on.
The scope of this tutorial is likely to be actually even broader, because the process I described here not only applies to the
AnyChart JS charting library, but also is mostly the same for its sister libraries
AnyMap (geovisualization in maps),
AnyStock (date/time graphs), and
AnyGantt (charts for project management). All of them are free for non-profit projects but – I must put it clearly here again just in case – require a special
license for commercial use.
I hope you find this article helpful in your activities when it comes to interactive data visualization in R. Now ask your questions, please, if any.