Find the next number in the sequence

Find the next number in the sequence
by Jerry Tuttle

Between ages two and four, most children can count up to at 
least ten.  If you ask your child, "What number comes next after 1, 2, 3, 4, 5?" they will probably say "6."

But to math nerds, any number can be the next number in a finite sequence. I like -14.

Given a sequence of n real numbers f(x1), f(x2), f(x3), ... , f(xn), there is always a mathematical procedure to find the next number f(x n+1) of the sequence. The resulting solution may not appear to be satisfying to students, but it is mathematically logical.

I can draw a smooth curve through the points (1,1), (2,2), (3,3), (4,4), (5,5), (6, -14). If I can find an equation for that smooth curve, then I know my answer of -14 has some logic to it. Actually many equations will work.
In my example one equation is of the form y = (x-1)*(x-2)*(x-3)*(x-4)*(x-5)*(A/120) + x, where A is chosen so that when x is 6, the first term reduces to A, and A + 6 equals the -14 I want. So A is -20. This is called a collocation polynomial.

There is a theorem that for n+1 distinct values of xi and their corresponding yi values, there is a unique polynomial P of degree n with P(xi) = yi. One method to find P is to use polynomial regression. Another way is to use Newton's Forward Difference Formula (probably no longer taught in Numerical Analysis courses).

Higher degree polynomials than degree n is one reason why additional equations will work.

The equation does not have to be a polynomial, which then adds rational functions among others.

Of course the next number after -14 can be any number. It could be 7 :)

There are many famous sequences, and of course someone catalogued  them.

Here is some R code.

xpoints <- c(1,2,3,4,5,6)
ypoints <- c(1,2,3,4,5,-14)
y <- vector()
x <- seq(from=1, to=6, by=.01)
y <- (x-1)*(x-2)*(x-3)*(x-4)*(x-5)*(-20/120) + x
plot(xpoints, ypoints, pch=18, type="p", cex=2, col="blue", xlim=c(1,6), ylim=c(-14,6), xlab="x", ylab="y")
lines(x,y, pch = 19, cex=1.3, col = "red")
fit <- lm(ypoints ~ xpoints + I(xpoints^2) + I(xpoints^3) +I(xpoints^4) +I(xpoints^5) )
s <- summary(fit)
bo <- s$coefficient[1]
b1 <- s$coefficient[2]
b2 <- s$coefficient[3]
b3 <- s$coefficient[4]
b4 <- s$coefficient[5]
b5 <- s$coefficient[6]
x <- seq(from=1, to=6, by=.01)
z <- bo+b1*x+b2*x^2+b3*x^3+b4*x^4+b5*x^5
plot(xpoints, ypoints, pch=18, type="p", cex=2, col="blue", xlim=c(1,6), ylim=c(-14,6), xlab="x", ylab="y")
lines(x,z, pch = 19, cex=1.3, col = "red")


Using Google Trends and GDELT datasets to explore societal trends

Learn how to use novel datasets such as Google Trends and GDELT, while contributing to charity! Join our workshop on Using Google Trends and GDELT datasets to explore societal trends which is a part of our workshops for Ukraine series. 
Here’s some more info: 
Title: Using Google Trends and GDELT datasets to explore societal trends
Date: Thursday, January 12th 18:00 – 20:00 CET (Rome, Berlin, Paris time zone)
Speaker: Harald Puhr, PhD in international business and assistant professor at the University of Innsbruck. His research and teaching focuses on global strategy, international finance, and data science/methods—primarily with R. As part of his research, Harald developed the globaltrends package (available on CRAN) to handle large-scale downloads from Google Trends.
Description: Researchers and analysts are frequently interested in what topics matter for societies. These insights are applied to research fields ranging from Economics to Epidemiology to better understand market demand, political change, or the spread of infectious diseases. In this workshop, we consider Google Trends and GDELT (Global Database of Events, Language, and Tone) as two datasets that help us to explore what matters for societies and whether these issues matter everywhere. We will use these datasets in R and Google Big Query for analysis of online search volume and media reports, and we will discuss what they can tell us about topics that move societies.
Minimal registration fee: 20 euro (or 20 USD or 750 UAH)


How can I register?

  • Save your donation receipt (after the donation is processed, there is an option to enter your email address on the website to which the donation receipt is sent)

  • Fill in the registration form, attaching a screenshot of a donation receipt (please attach the screenshot of the donation receipt that was emailed to you rather than the page you see after donation).

If you are not personally interested in attending, you can also contribute by sponsoring a participation of a student, who will then be able to participate for free. If you choose to sponsor a student, all proceeds will also go directly to organisations working in Ukraine. You can either sponsor a particular student or you can leave it up to us so that we can allocate the sponsored place to students who have signed up for the waiting list.

How can I sponsor a student?
  • Save your donation receipt (after the donation is processed, there is an option to enter your email address on the website to which the donation receipt is sent)

  • Fill in the sponsorship form, attaching the screenshot of the donation receipt (please attach the screenshot of the donation receipt that was emailed to you rather than the page you see after the donation). You can indicate whether you want to sponsor a particular student or we can allocate this spot ourselves to the students from the waiting list. You can also indicate whether you prefer us to prioritize students from developing countries when assigning place(s) that you sponsored.


If you are a university student and cannot afford the registration fee, you can also sign up for the waiting list here. (Note that you are not guaranteed to participate by signing up for the waiting list).

You can also find more information about this workshop series,  a schedule of our future workshops as well as a list of our past workshops which you can get the recordings & materials here.
Looking forward to seeing you during the workshop!

Some problems related to Dice

It was when I and one of my friends, Ahel, were playing a game of Ludo, that an idea struck both of our heads. Being final year undergraduate students of Statistics, both of us pondered upon the question, what if we can do some verification for some questions on dice. This brief spark in our brains led us to properly formulate the questions, think and write the solutions using mathematical concepts, and finally simulate them. Note that we did all the simulations using the R programming language. We also included the animation package in R for some visualisations of our graph.

https://gist.github.com/itsdebartha/a958d152c8961768f88a5db8493fedd0
Setting the seed for reproducibility

So here goes our questions:

On average, how many times must a 6-sided die be rolled until a 6 turns up?

This seems like an easy one, right? It tells us, that if we are to roll a normal 6-sided die, when can we expect the face showing 6 to turn up. We create a function to do this simulation:

https://gist.github.com/itsdebartha/668dbfcfeedbdb774e7e5f9a640a9c7c
The function for calculating the expected number of rolls until the first 6

We then do a Monte Carlo simulation, to get as close to our theoretical answer as possible:

https://gist.github.com/itsdebartha/f2a0564be6d554a438a654a73cb3c670
Monte Carlo simulation

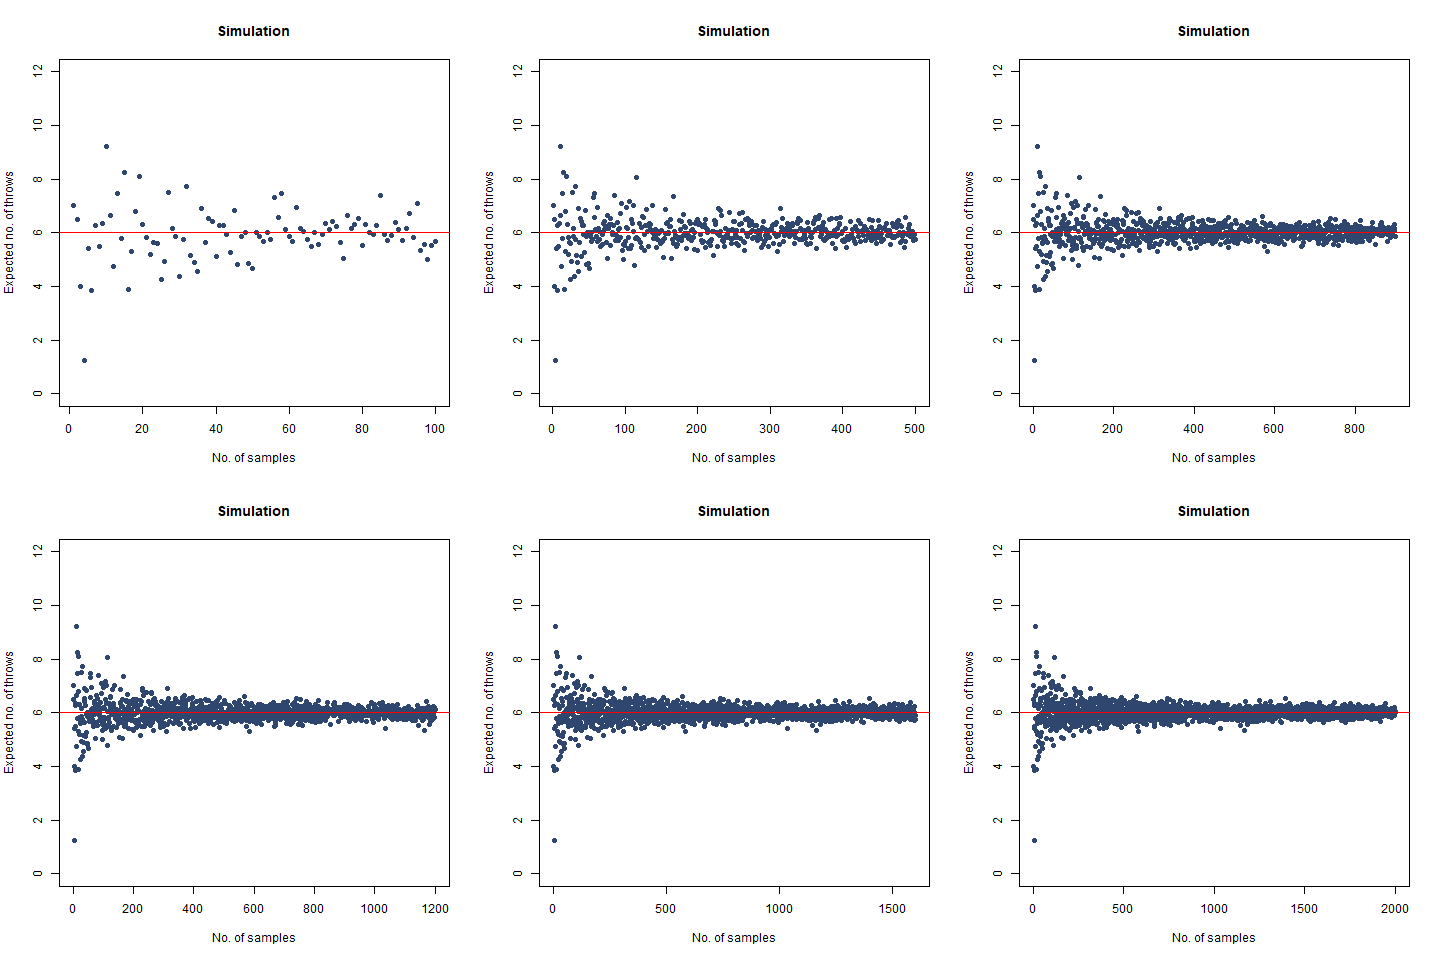
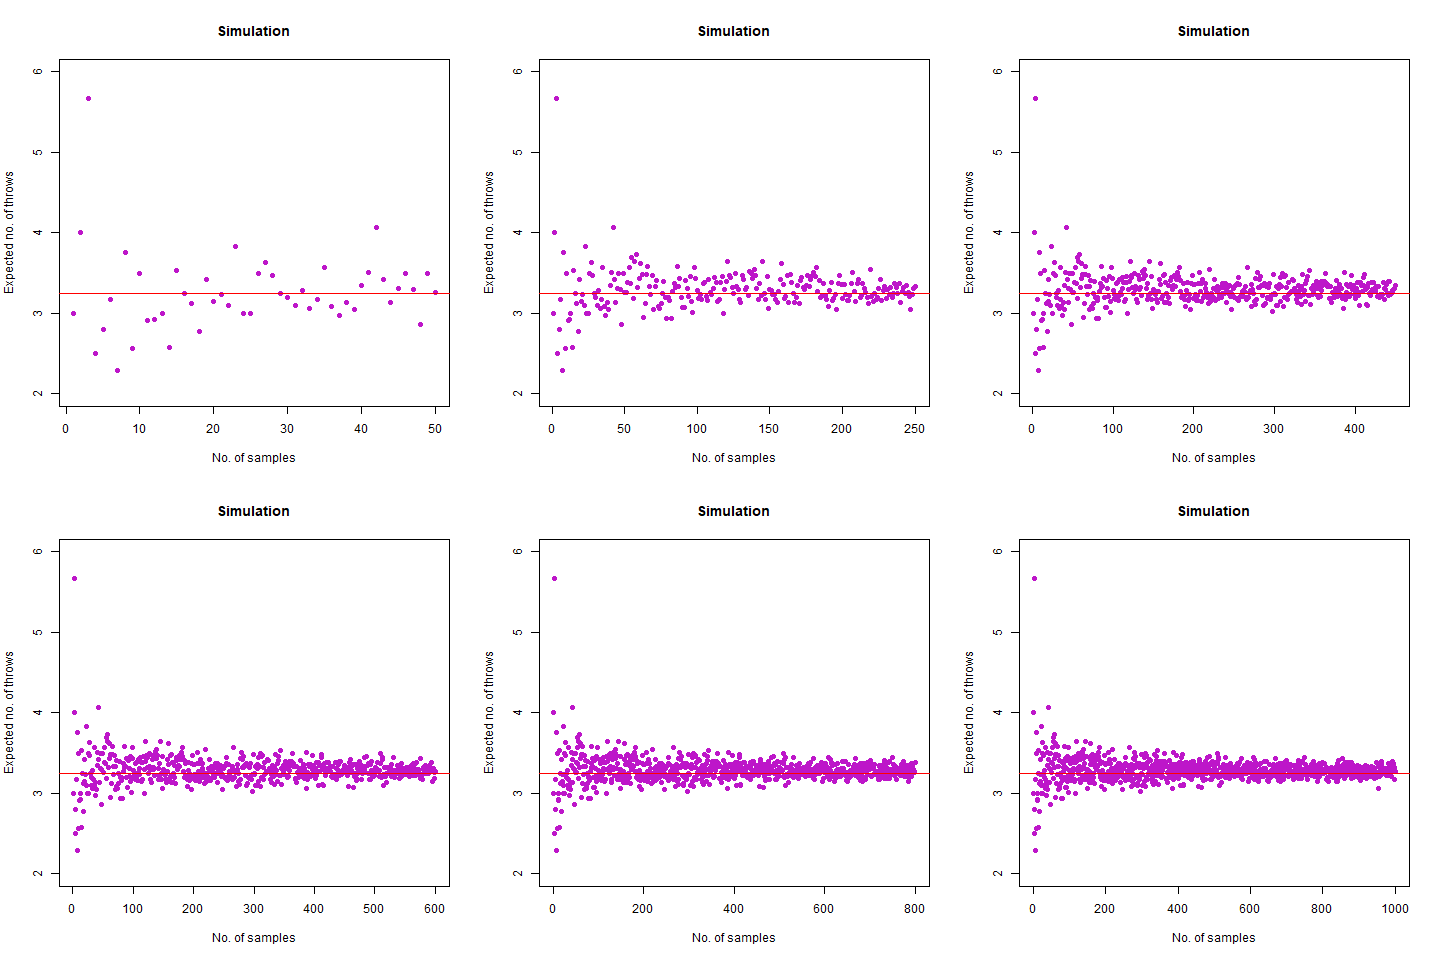
The result we got was 6.018 , which, almost coincides with the theoretical value of 6 . We further create a graph that helps us see the convergence more clearly.

The graph of the expected number of throws vs sample numbers. We notice that as we take a larger sample size, the expected number of throws converges to 6 which is the exact number of throws shown mathematically.

On average, how many times must a 6-sided die be rolled until a 6 turns up twice a row?

We can think of this as an extension of the previous problem. However, in this case, we will stop after two successive rolls result in two 6s. Thus, if we roll a 6, we roll again and then we will get any one of the two results:

  • We get a 6 again. If this happens, we stop
  • We get anything other than a 6. Then we continue rolling.

We can use a function to simulate, which is a bit different from the last one:

https://gist.github.com/itsdebartha/ae3d43b8dc2f8090b82659787627141f
The function for calculating the expected number of rolls until two consecutive 6s

We then do a Monte Carlo simulation, to get as close to our theoretical answer as possible:

https://gist.github.com/itsdebartha/0bc57da8ba97b493c5d064ff76e8d2fd

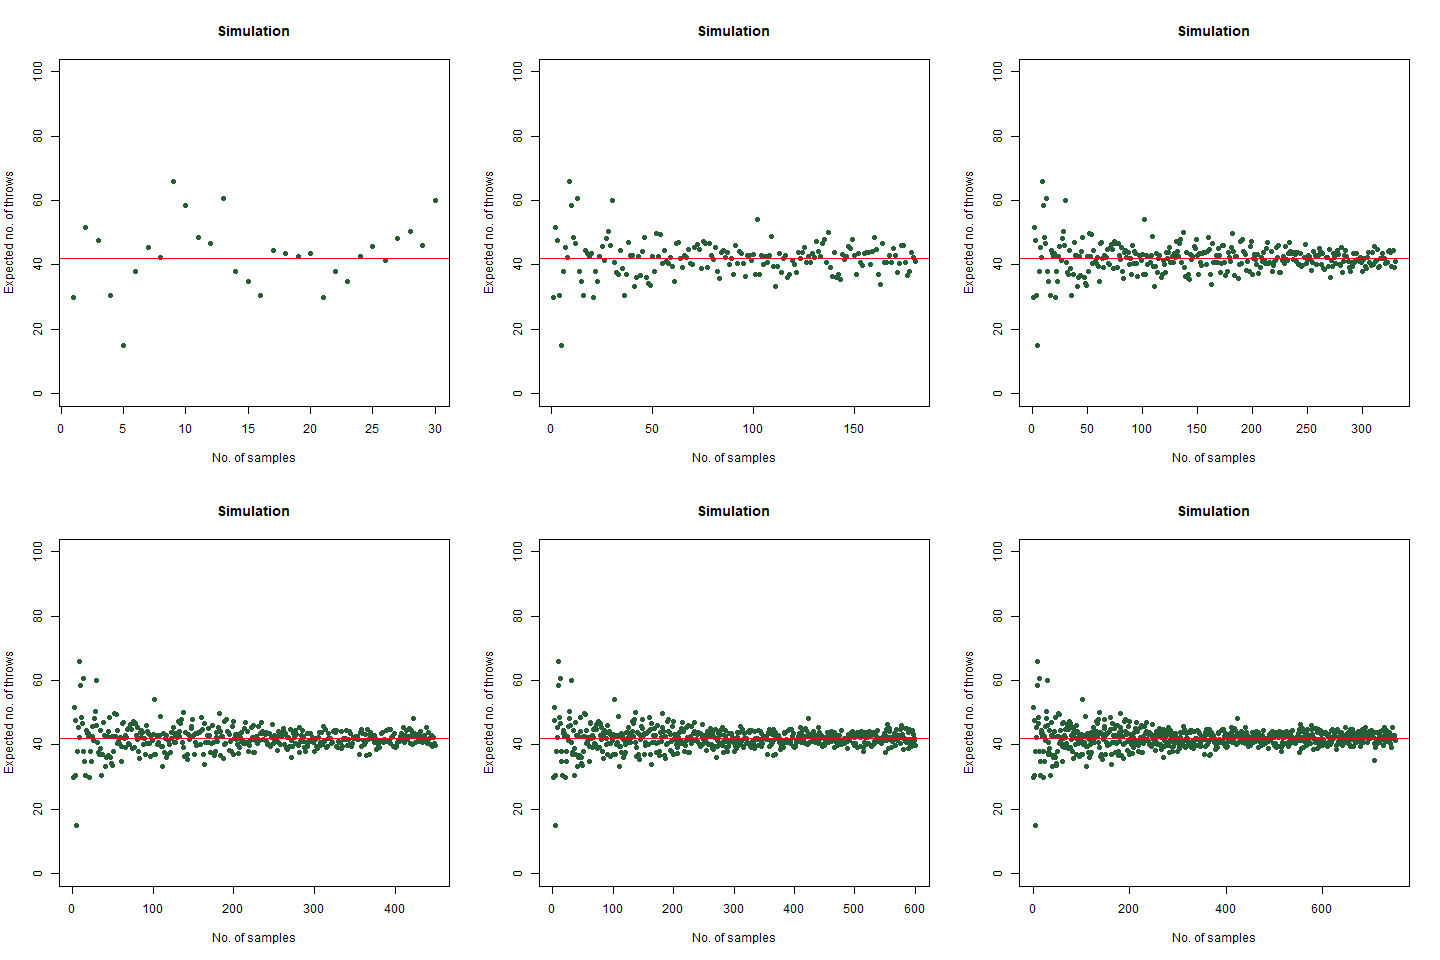
The result that was expected (as shown mathematically) is 42 . From the simulation, we got the result as 42.32468 , which is almost as close as our theoretical observation. The below graph summarises the above statements:

The graph of the expected number of throws vs sample numbers. We notice that as we take a larger sample size, the expected number of throws converges to 42 which is the exact number of throws shown mathematically.

On average, how many times must a 6-sided die be rolled until the sequence 65 appears (that is a 6 followed by a 5)?

What are the possible cases that we can run into, after throwing a 6?

  • We roll again, and we get a 6. This is a redundant case and we move again.
  • We roll again, and we get a 5. We stop if this happens.
  • We roll again, and we get something else. We continue rolling.
  • We roll again, and we get a 6. This is a redundant case and we move again.
  • We roll again, and we get a 5. We stop if this happens.
  • We roll again, and we get something else. We continue rolling.
https://gist.github.com/itsdebartha/28928404a51c6b5ae254236c7f1f466d

We then do a Monte Carlo simulation, to get as close to our theoretical answer as possible:

https://gist.github.com/itsdebartha/dcd6f877b8d5b9c2bec511a817254c0d

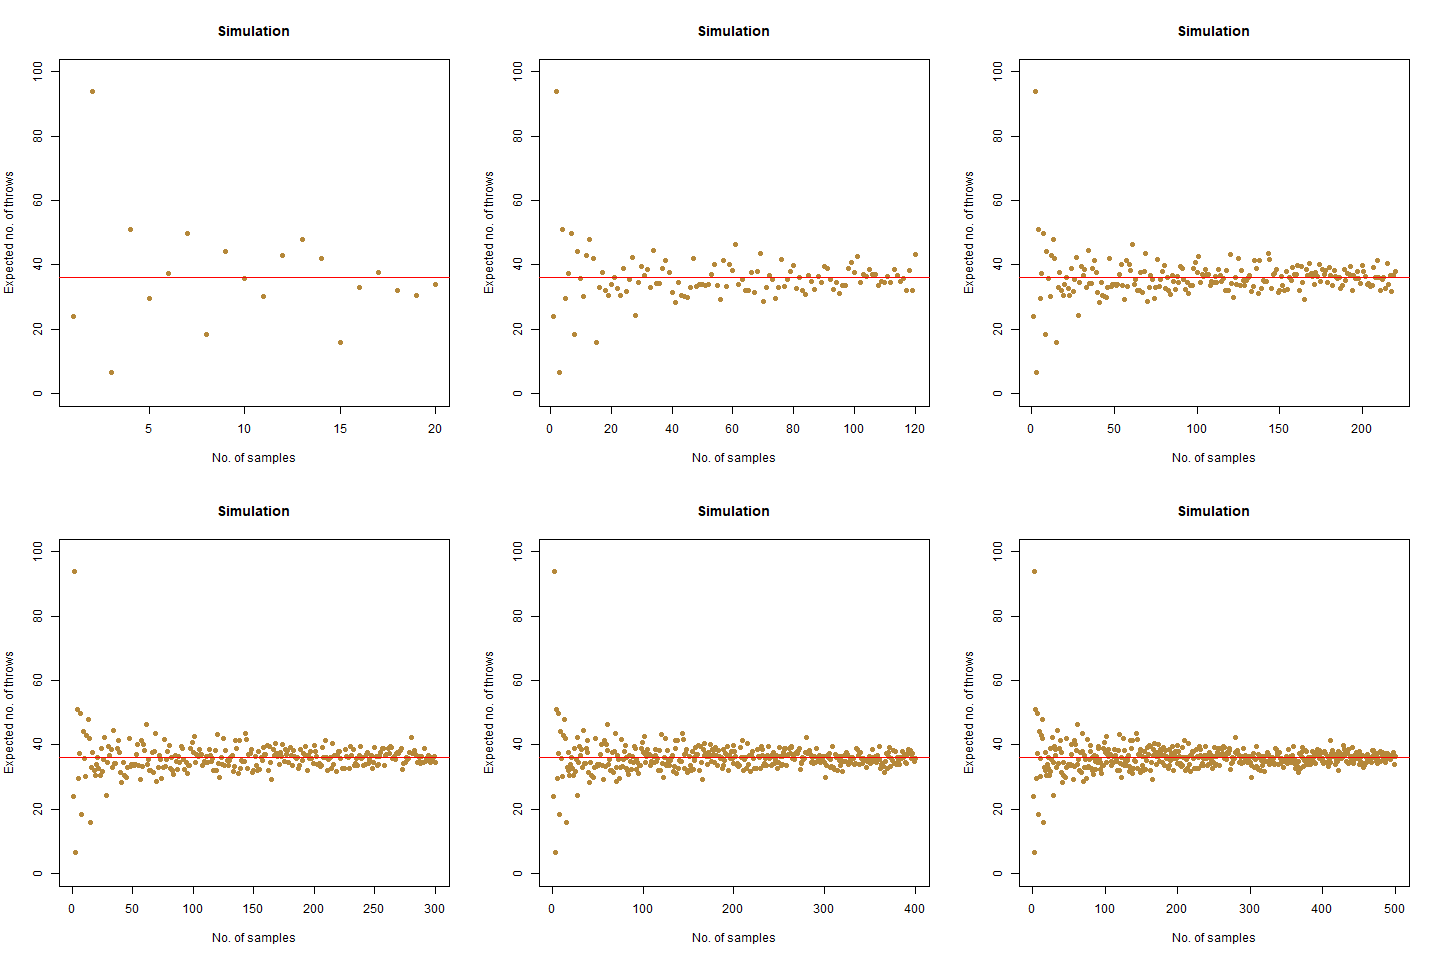
We expected the number of throws to be 36 . Upon doing simulation, we found our result as 36.07392 , which is almost accurate. We have the following animation which summarises the fact:

The graph of the expected number of throws vs sample numbers. We notice that as we take a larger sample size, the expected number of throws converges to 36 which is the exact number of throws shown mathematically.

Note:

The number of throws, in this case, is smaller than in the previous case, though both appear to be almost the same. The reason is intuitive in the fact that after rolling a 6, we can find three cases for this question, of which one is redundant, but not to be ignored, whereas, for the previous one, we only find two possible scenarios.

On average, how many times must a 6-sided die be rolled until two rolls in a row differ by 1 (such as a 2 followed by a 1 or 3, or a 6 followed by a 5)?

This is an interesting one. Suppose we roll a 4. Then three cases may happen:

  • We roll a 3. In that case, we stop.
  • We roll a 5. In that case, we stop.
  • We roll anything else. Here, we continue rolling.

Consider the following function for our work:

https://gist.github.com/itsdebartha/90353161ef91e07bbe5787a8c837285b

We then do a Monte Carlo simulation, to get as close to our theoretical answer as possible:

https://gist.github.com/itsdebartha/a26dbf8afe93ba43c9e7ffebc6b2e55a

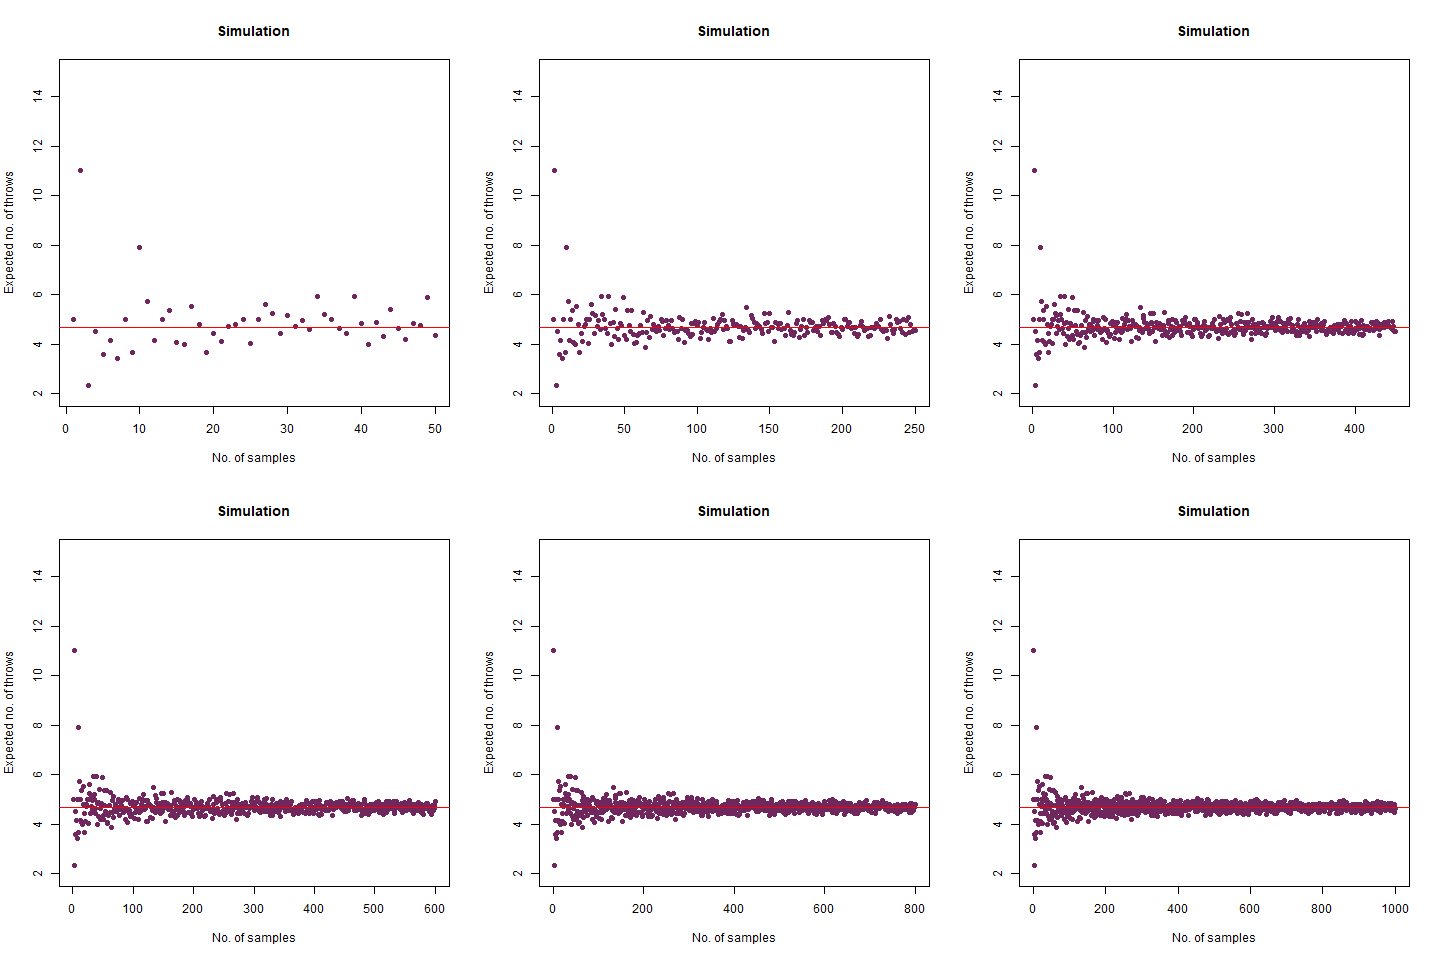
The result of the simulation was 4.69556 which is much closer to the theoretically expected value of 4.68 . We again provide a graph, which describes the convergence adequately:

The graph of the expected number of throws vs sample numbers. We notice that as we take a larger sample size, the expected number of throws converges to 4.68 which is the exact number of throws shown mathematically.

Bonus Question: What if we roll until two rolls in a row differ by no more than 1 (so we stop at a repeated roll, too)?

This question differs from its other part in the sense that here, successive rolls can be equal also for the experiment to stop. With just a minute tweak in the previous function, we can derive the new function for simulating this problem:

https://gist.github.com/itsdebartha/46f7ae9571d19fa707147e54256d72f7

We then do a Monte Carlo simulation, to get as close to our theoretical answer as possible:

https://gist.github.com/itsdebartha/78adce9833d8031fa1b5fd4908526380

We expected the value to be close to our mathematical value of 3.278 . From the simulation, we obtained the result as 3.292 . Further, we create the following graph:

The graph of the expected number of throws vs sample numbers. We notice that as we take a larger sample size, the expected number of throws converges to 3.27 which is the exact number of throws shown mathematically.

We roll a 6-sided die n times. What is the probability that all faces have appeared?

Intuitively, as the number of throws is increased, i.e. n increases, the probability that all the faces have appeared reaches 1 . Fixing a particular value of n , the mathematical probability which we got is as follows:

Now suppose we would like to simulate this experiment. Consider the following function for the work:

https://gist.github.com/itsdebartha/0e883e231f8ff822d7dfbc43ff413738

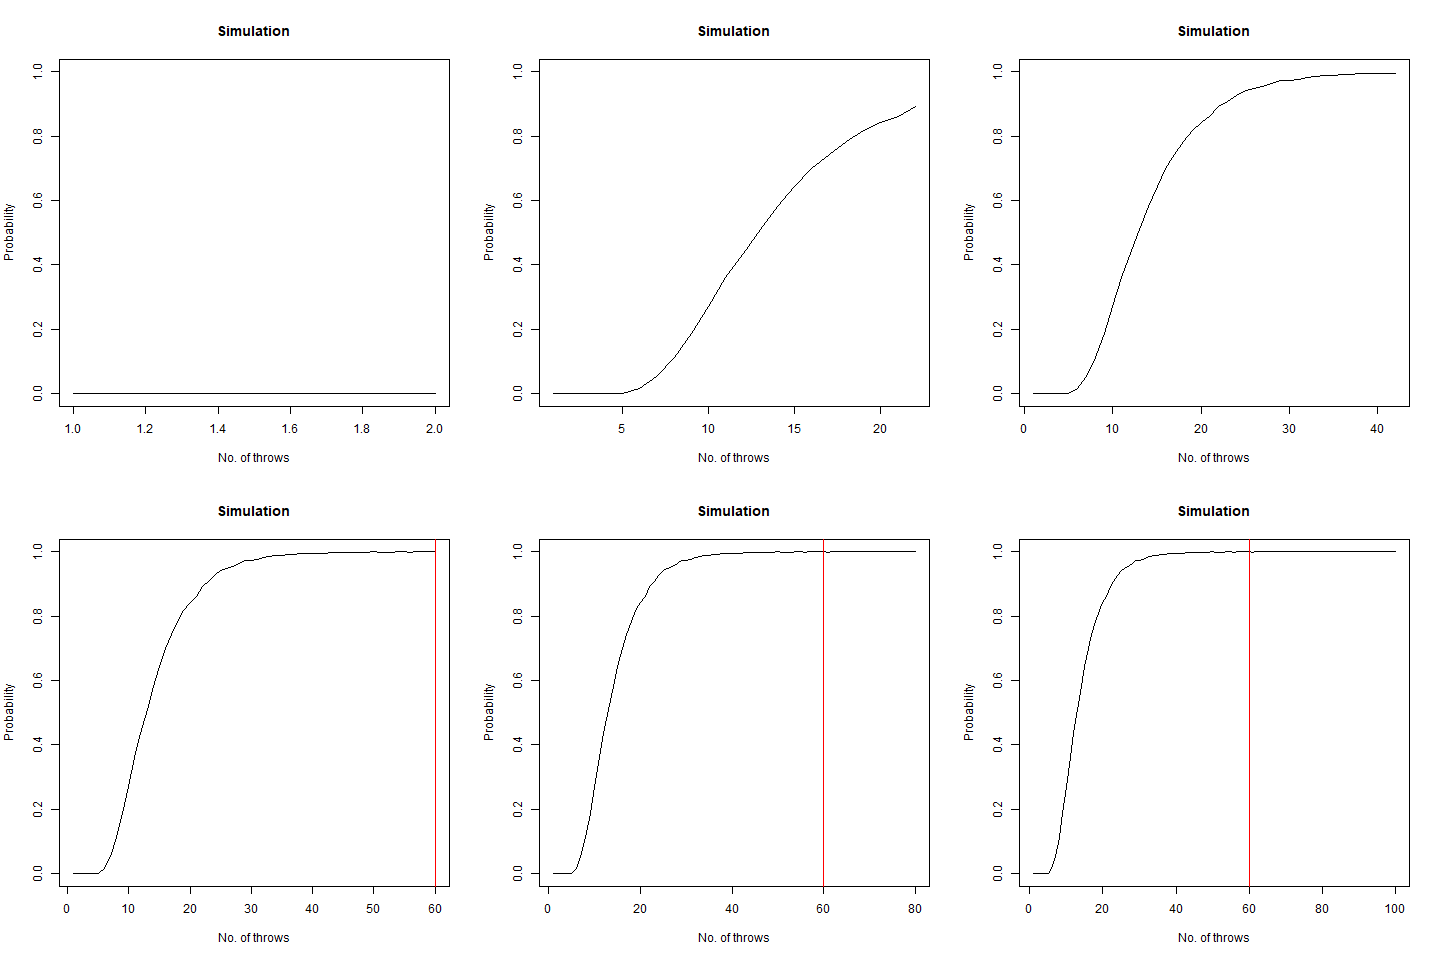
We vary our n from 1 to 100 and find that after n=60 , the probability becomes 1 almost surely. This is depicted in the following graph:

The graph of the probability of getting all faces vs the number of throws. We notice that as we number of throws, this probability converges to 1.

We roll a 6-sided die n times. What is the probability that all faces have appeared in order in six consecutive throws?

In short, this question asks what is the probability that among all the throws, sequence 1,2,3,4,5,6 appears. We once again create a function for our task:

https://gist.github.com/itsdebartha/ea03eb51634dc3b472f23e9e2e7b29b9

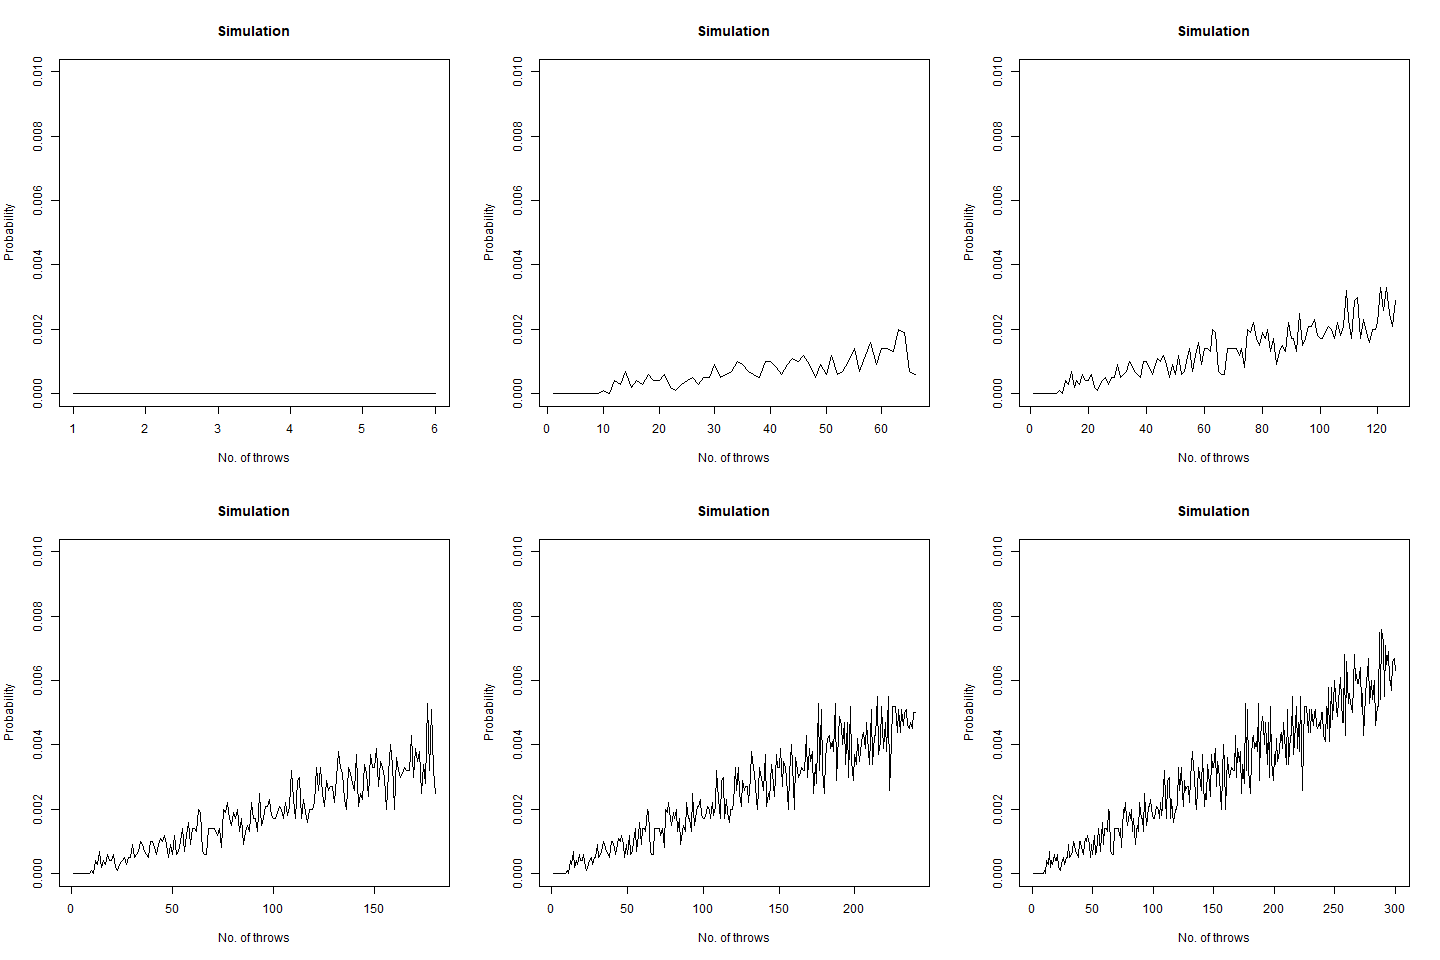
The following graph demonstrates that as the number of throws increases, this probability increases:

The graph of the probability of getting all faces vs the number of throws. We notice that as we number of throws, this probability increases.

Taking our n as 300000 , we find that this probability becomes around 0.99 . This implies that the probability converges to 1 as n increases.

Person A rolls n dice and person B rolls m dice. What is the probability that they have a common face showing up?

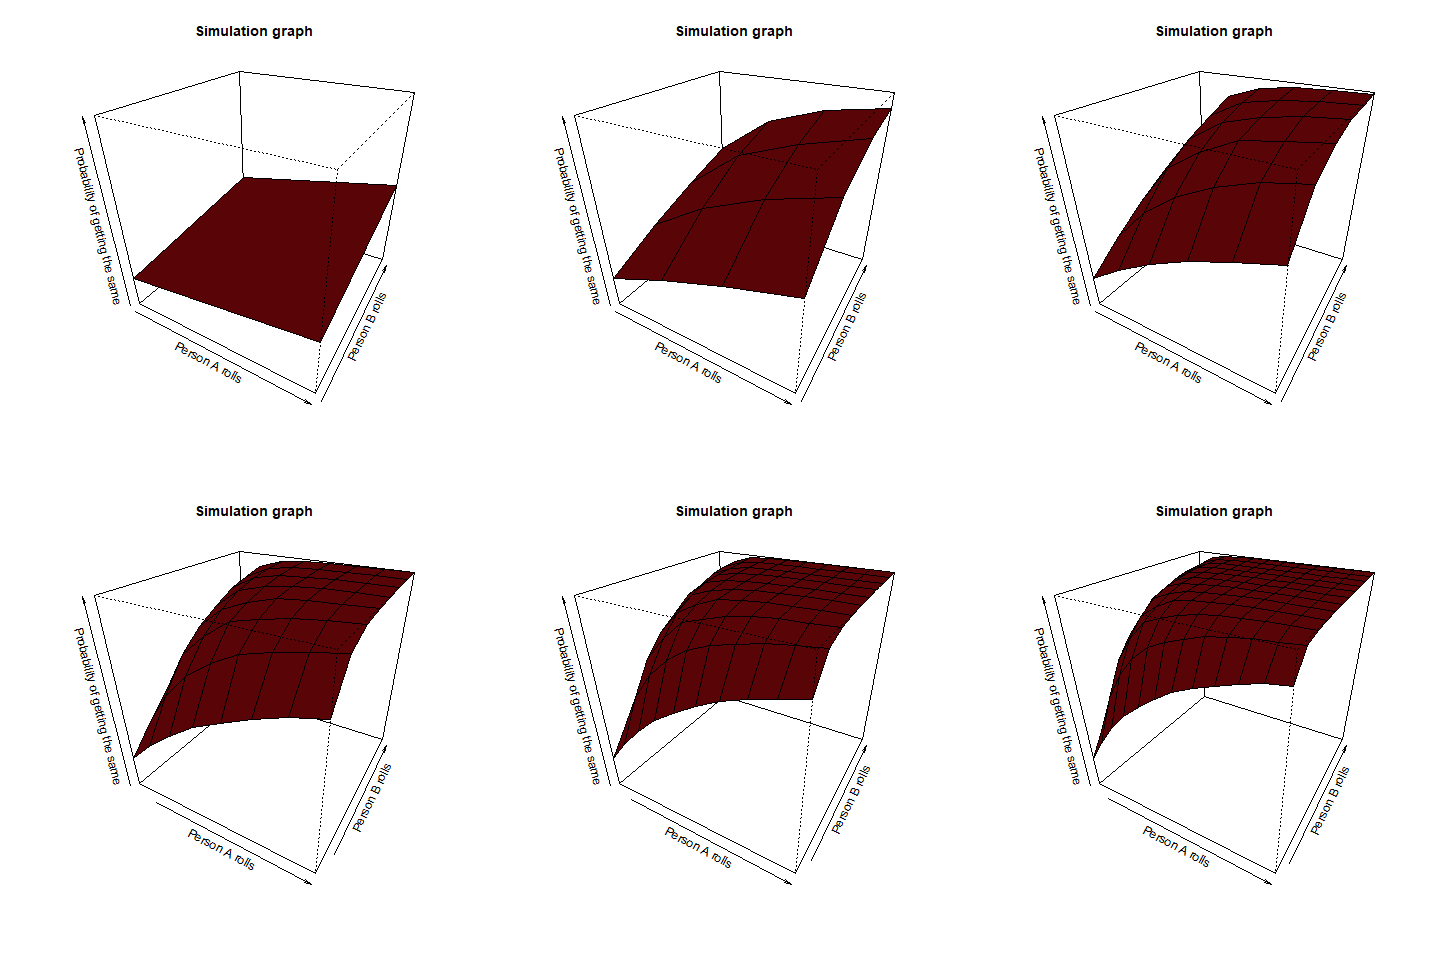
This question asks us that if person A rolled a 2, then what is the probability that person B also rolled a 2 among all the dice throws. This is a pretty straightforward question. Intuitively, we can observe, that the value of n and m increases (even a slight bit as >12), the corresponding probability reaches 1. We once again take the help of a function for our purpose:

https://gist.github.com/itsdebartha/c7d73bee9f2ca461e7cee57e0642c76c

We then create a matrix structure which gives us the probability for the values of m and n :

https://gist.github.com/itsdebartha/240f0a6a9a2135297eb514f5515b55b3

The underlying graph confirms this intuition:

We find from this graph that as m and n increases (even >12), the value of this probability reaches 1

On average, how many times must a pair of 6-sided dice be rolled until all sides appear at least once?

Suppose, we have a die, and we throw it. Then this question asks us to find out the average number of such throws required such that all the faces appear at least once. Now simulating this experiment can be done in a pretty interesting way with the help of a Markov Chain. However, for the sake of simplicity, consider the following function for our use case:

https://gist.github.com/itsdebartha/2bdc865dac30dc902da1b521e54b28b4

The mathematical value that we got after calculating is around 7.6 which, when rounded off becomes 8. We then proceed to do a Monte Carlo simulation of our experiment:

https://gist.github.com/itsdebartha/58a3a6a9ceff23dc711a87558352e883

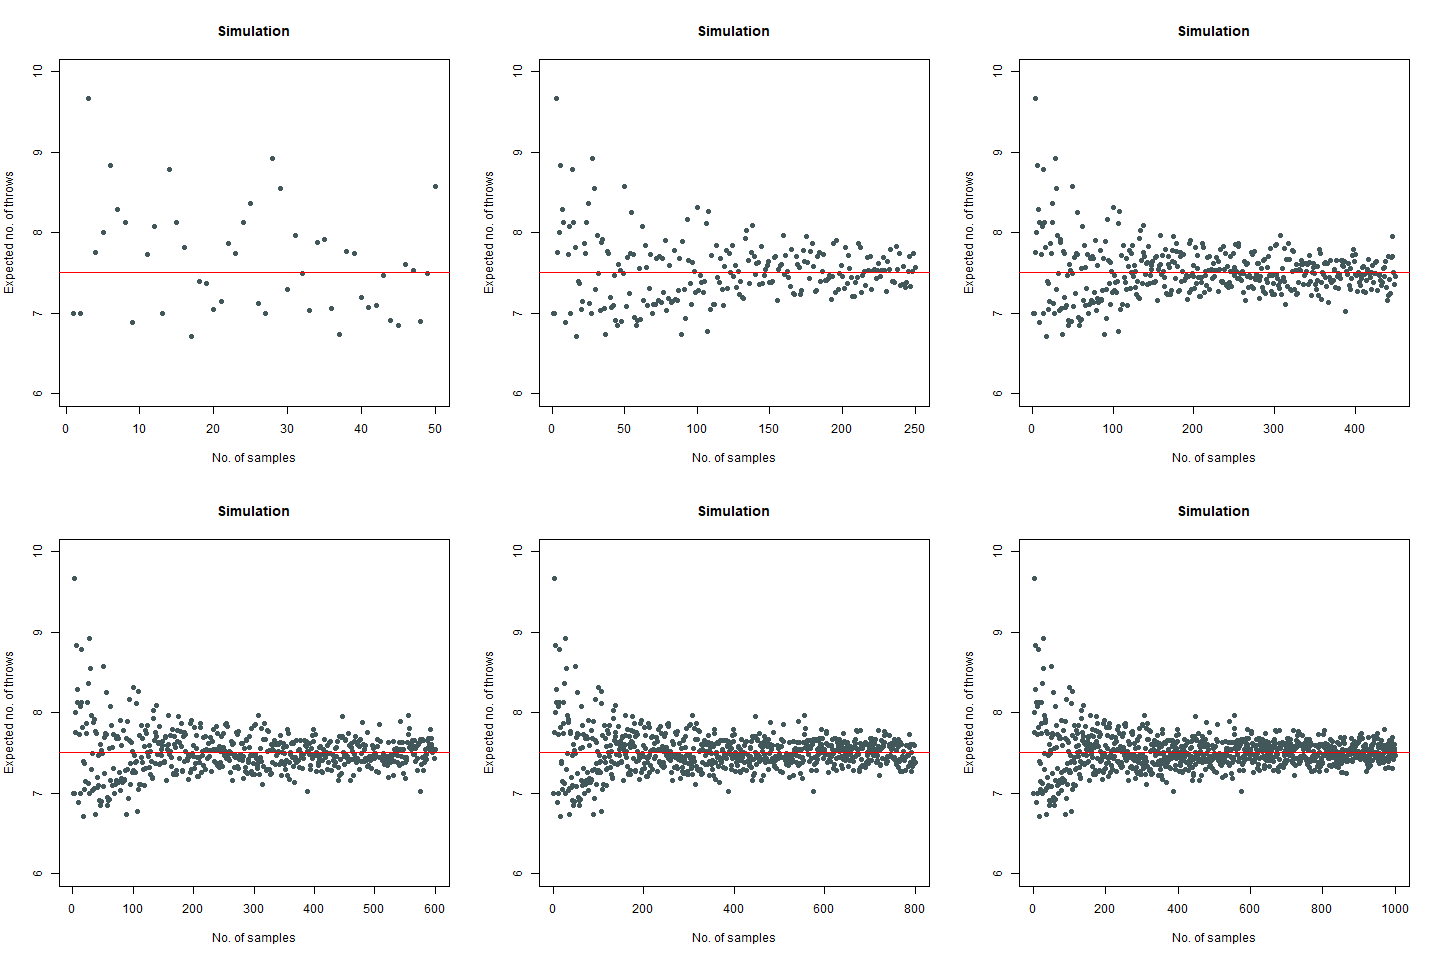
Here, we find that the value is 7.5, which again rounds off to 8. That’s not the end of it. We further create a plot which can sharpen our views regarding this experiment:

We observe that the number of throws steadies at around 7.5, which turns out to be 8

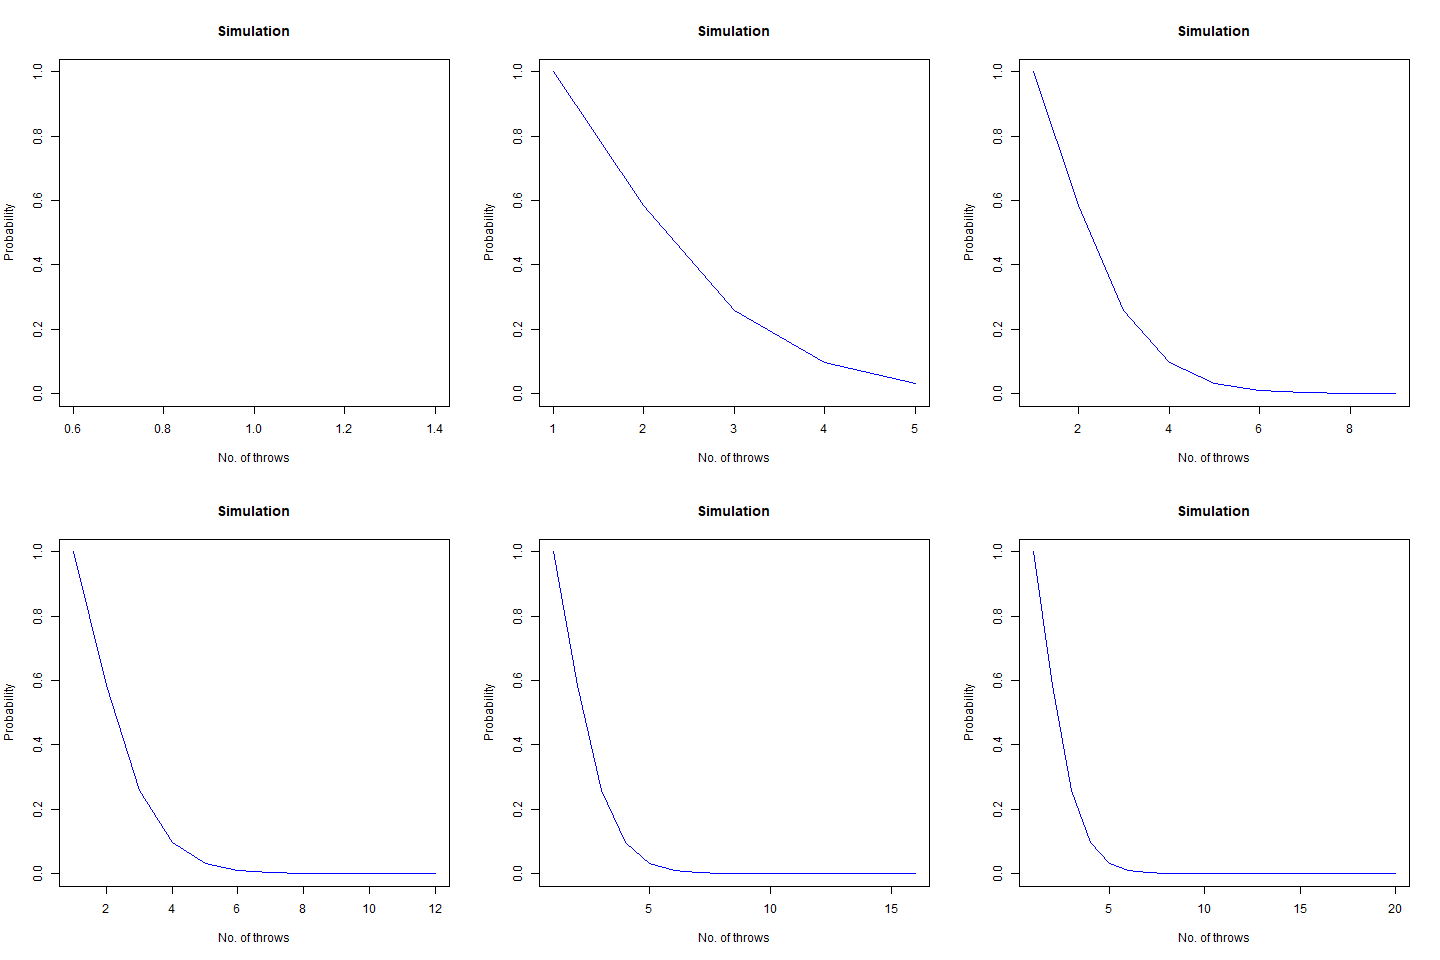
Further, we find that the probability that our required rolls will be more than 24 is almost negligible (at around 7e-04).

Suppose we can roll a 6-sided die up to n times. At any time we can stop, and that roll becomes our “score”. Our goal is to get the highest possible score, on average. How should we decide when to stop?

This is a particularly vexing problem. We note that our stopping condition is when we will get a number smaller than the average at the nth throw. Consider the following function for this problem:

https://gist.github.com/itsdebartha/bd3286a728726daded939da441f98230

We proceed to do a Monte Carlo Simulation:

https://gist.github.com/itsdebartha/faabb3c7f96b3c096ea7085557e446ce

We thus create a stopping rule and draw the following conclusion regarding the highest possible score on an average:

• If n=1, we choose our score as 3

• If 1<n<4, we choose our score as 4

• If n>3, we choose our score as 5

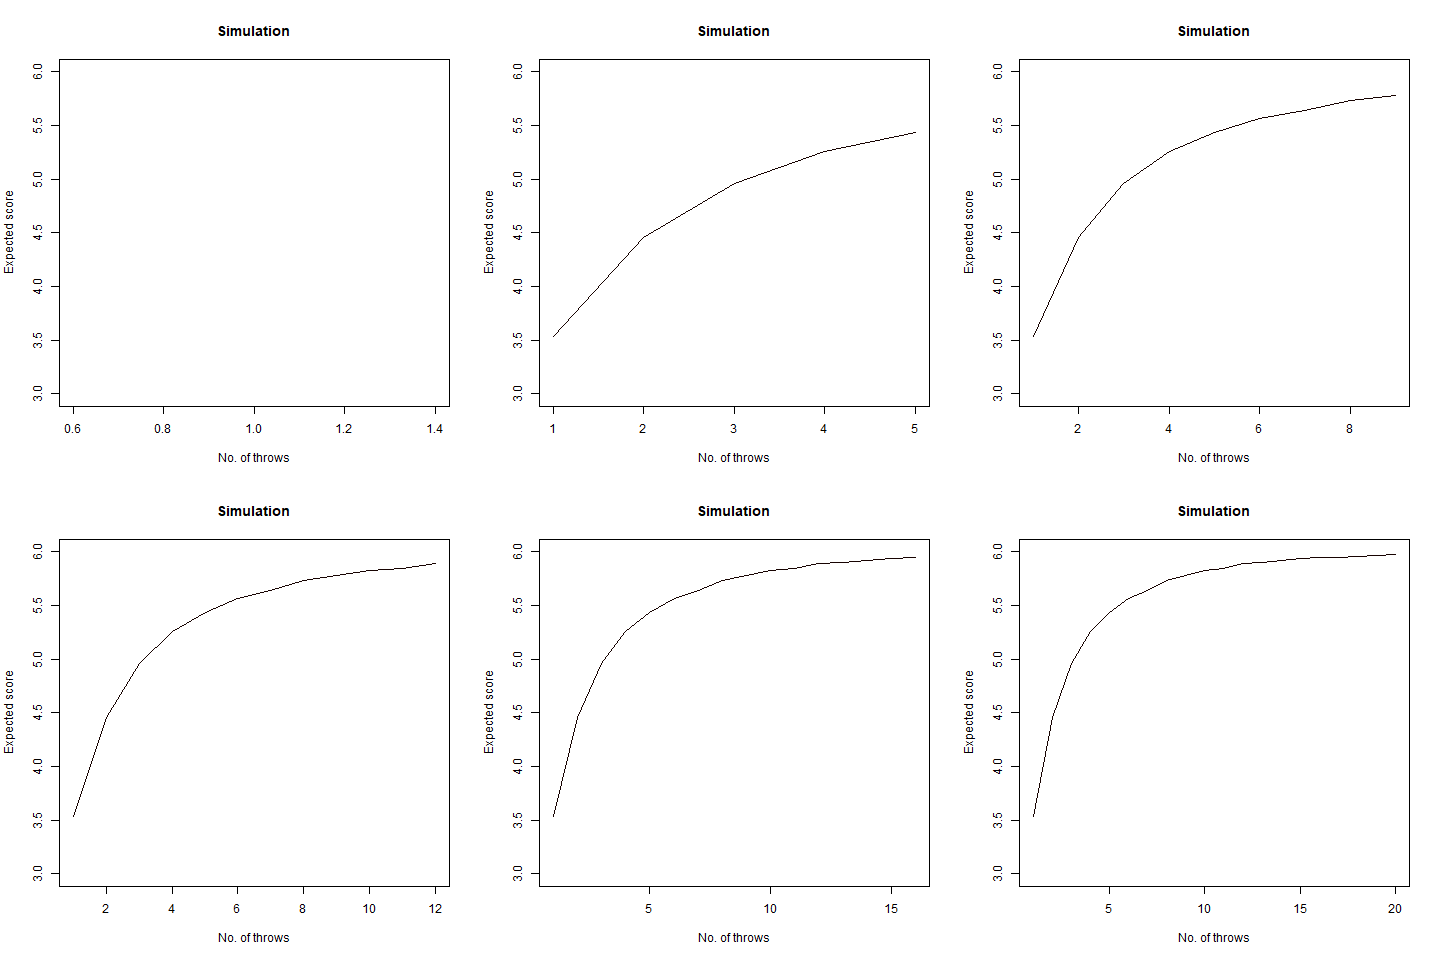
Finally, we draw a graph of our findings:

We note that as n increases, so is our score and it almost reaches 6

Suppose we roll a fair dice 10 times. What is the probability that the sequence of rolls is non-decreasing?

Suppose we get a sequence of faces as such: 1,1,2,3,2,2,4,5,6,6. We can clearly see that this is not at all a non-decreasing sequence. However, if we get a sequence of faces as like: 1,1,1,1,2,2,4,5,6,6, we can see that this is a non-decreasing sequence. Our question asks us to find the probability of getting a sequence like the second type. We again build a function as:

https://gist.github.com/itsdebartha/5fcfdd11762a5d1b91ba25b59a899885

We expect our answer to be around 4.96e-05. We continue to do the Monte Carlo simulation:

https://gist.github.com/itsdebartha/a62c7c82c50a9fcb8aa0257d2959ddd8

The result that we get after simulating is 5.1e-05 which is pretty close to our value. Finally, we create a graph:

We note that as n increases, our required probability goes down to 0

We thus come to the end of our little discussion here. Do let us know how you feel about this whole thing. Also, feel free to connect with us on LinkedIn:

Debartha Paul

Ahel Kundu

You might also want to check out the GitHub repository for this project here: Dice Simulations

Introduction to efficiency analysis in R workshop

Learn how to use Introduction to efficiency analysis in R, while contributing to charity! Join our workshop on Introduction to efficiency analysis in R that is a part of our workshops for Ukraine series. 

Here’s some more info: 
Title: Introduction to efficiency analysis in R
Date: Thursday, November 17th, 18:00 – 20:00 CEST (Rome, Berlin, Paris timezone)
Speaker:
Olha Halytsia, PhD Economics student at the Technical University of Munich. She has a previous working experience in research within the World Bank project, also worked at the National Bank of Ukraine.
Description: In this workshop, we will cover all steps of efficiency analysis using production data.  Firstly, we will introduce the notion of efficiency with a special focus on technical efficiency and briefly discuss parametric (stochastic frontier model) and non-parametric approaches to efficiency estimation (data envelopment analysis). Subsequently, with help of “Benchmarking” and “frontier” R packages, we will get estimates of technical efficiency and discuss the implications of our analysis. This workshop may be useful for beginners who are interested in working with input-output data and want to learn how R can be used for econometric production analysis.
Minimal registration fee: 20 euro (or 20 USD or 750 UAH)

How can I register?
  • Save your donation receipt (after the donation is processed, there is an option to enter your email address on the website to which the donation receipt is sent)
  • Fill in the registration form, attaching a screenshot of a donation receipt (please attach the screenshot of the donation receipt that was emailed to you rather than the page you see after donation).
If you are not personally interested in attending, you can also contribute by sponsoring a participation of a student, who will then be able to participate for free. If you choose to sponsor a student, all proceeds will also go directly to organisations working in Ukraine. You can either sponsor a particular student or you can leave it up to us so that we can allocate the sponsored place to students who have signed up for the waiting list.

How can I sponsor a student?
  • Save your donation receipt (after the donation is processed, there is an option to enter your email address on the website to which the donation receipt is sent)
  • Fill in the sponsorship form, attaching the screenshot of the donation receipt (please attach the screenshot of the donation receipt that was emailed to you rather than the page you see after the donation). You can indicate whether you want to sponsor a particular student or we can allocate this spot ourselves to the students from the waiting list. You can also indicate whether you prefer us to prioritize students from developing countries when assigning place(s) that you sponsored.

If you are a university student and cannot afford the registration fee, you can also sign up for the waiting list here. (Note that you are not guaranteed to participate by signing up for the waiting list).

You can also find more information about this workshop series,  a schedule of our future workshops as well as a list of our past workshops which you can get the recordings & materials here.
Looking forward to seeing you during the workshop!

TidyFinance: Financial Data in R workshop

Learn how to use TidyFinance package to retrieve and explore financial data, while contributing to charity! Join our workshop on TidyFinance: Financial Data in R that is a part of our workshops for Ukraine series. 
Here’s some more info: 
Title: TidyFinance: Financial Data in R
Date: Thursday, November 24th, 18:00 – 20:00 CET (Rome, Berlin, Paris timezone)
Speaker: Patrick Weiss, PhD, CFA is a postdoctoral researcher at Vienna University of Economics and Business. Jointly with Christoph Scheuch and Stefan Voigt, Patrick wrote the open-source book www.tidy-finance.org, which serves as the basis for this workshops. Visit his webpage for additional information.
Description: This workshop explores financial data available for research and practical applications in financial economics. The course relies on material available on www.tidy-finance.org and covers: (1) How to access freely available data from Yahoo!Finance and other vendors. (2) Where to find the data most commonly used in academic research. This main part covers data from CRSP, Compustat, and TRACE. (3) How to store and access data for your research project efficiently. (4) What other data providers are available and how to access their services within R.
Minimal registration fee: 20 euro (or 20 USD or 750 UAH)

How can I register?
  • Go to  https://bit.ly/3PFxtNA and donate at least 20 euro. Feel free to donate more if you can, all proceeds go directly to support Ukraine.
  • Save your donation receipt (after the donation is processed, there is an option to enter your email address on the website to which the donation receipt is sent)
  • Fill in the registration form, attaching a screenshot of a donation receipt (please attach the screenshot of the donation receipt that was emailed to you rather than the page you see after donation).

If you are not personally interested in attending, you can also contribute by sponsoring a participation of a student, who will then be able to participate for free. If you choose to sponsor a student, all proceeds will also go directly to organisations working in Ukraine. You can either sponsor a particular student or you can leave it up to us so that we can allocate the sponsored place to students who have signed up for the waiting list.

How can I sponsor a student?

  • Go to https://bit.ly/3PFxtNA and donate at least 20 euro (or 17 GBP or 20 USD or 750 UAH). Feel free to donate more if you can, all proceeds go to support Ukraine!
  • Save your donation receipt (after the donation is processed, there is an option to enter your email address on the website to which the donation receipt is sent)
  • Fill in the sponsorship form, attaching the screenshot of the donation receipt (please attach the screenshot of the donation receipt that was emailed to you rather than the page you see after the donation). You can indicate whether you want to sponsor a particular student or we can allocate this spot ourselves to the students from the waiting list. You can also indicate whether you prefer us to prioritize students from developing countries when assigning place(s) that you sponsored.

If you are a university student and cannot afford the registration fee, you can also sign up for the waiting list here. (Note that you are not guaranteed to participate by signing up for the waiting list).

You can also find more information about this workshop series,  a schedule of our future workshops as well as a list of our past workshops which you can get the recordings & materials here.
Looking forward to seeing you during the workshop!

Ebook launch – Simple Data Science (R)

Simple Data Science (R) covers the fundamentals of data science and machine learning. The book is beginner-friendly and has detailed code examples. It is available at scribd.

cover image

Topics covered in the book –
  • Data science introduction
  • Basic statistics
  • Graphing with ggplot2 package
  • Exploratory Data Analysis
  • Machine Learning with caret package
  • Regression, classification, and clustering
  • Boosting with lightGBM package
  • Hands-on projects
  • Data science use cases

Visualizing Regression Results in R workshop

Learn how to visualize regression results, while contributing to charity! Join our workshop on Visualizing Regression Results in R which is a part of our workshops for Ukraine series. 
Here’s some more info: 
Title: Visualizing Regression Results in R
Date: Thursday, December 1st, 18:00 – 20:00 CET (Rome, Berlin, Paris timezone)
Speaker: Dariia Mykhailyshyna, PhD Economics student at the University of Bologna. Previously worked at a Ukrainian think tank Centre of Economic Strategy. 
Description: In this workshop, we will look at how you can use ggplot and other packages to visualize regression results. We will explore different types of plots. Firstly, we will plot regression lines both for the bivariate regressions and multivariate regressions. We will also explore different ways of plotting regression coefficients and look at how we can visualize coefficients and standard error of multiple variables from a single regression, of a single variable from multiple regressions, and of multiple variables from multiple regressions. We will also learn how to plot other regression outputs, such as marginal effects, odds ratios and predicted values. In the process, we will also learn how to tidy the output of the regression model and convert it to the dataframe and how to automize the process of running regression by using a loop.
Minimal registration fee: 20 euro (or 20 USD or 750 UAH)


How can I register?

  • Save your donation receipt (after the donation is processed, there is an option to enter your email address on the website to which the donation receipt is sent)

  • Fill in the registration form, attaching a screenshot of a donation receipt (please attach the screenshot of the donation receipt that was emailed to you rather than the page you see after donation).

If you are not personally interested in attending, you can also contribute by sponsoring a participation of a student, who will then be able to participate for free. If you choose to sponsor a student, all proceeds will also go directly to organisations working in Ukraine. You can either sponsor a particular student or you can leave it up to us so that we can allocate the sponsored place to students who have signed up for the waiting list.

How can I sponsor a student?
  • Save your donation receipt (after the donation is processed, there is an option to enter your email address on the website to which the donation receipt is sent)

  • Fill in the sponsorship form, attaching the screenshot of the donation receipt (please attach the screenshot of the donation receipt that was emailed to you rather than the page you see after the donation). You can indicate whether you want to sponsor a particular student or we can allocate this spot ourselves to the students from the waiting list. You can also indicate whether you prefer us to prioritize students from developing countries when assigning place(s) that you sponsored.


If you are a university student and cannot afford the registration fee, you can also sign up for the waiting list here. (Note that you are not guaranteed to participate by signing up for the waiting list).

You can also find more information about this workshop series,  a schedule of our future workshops as well as a list of our past workshops which you can get the recordings & materials here.
Looking forward to seeing you during the workshop!

365 Data Science courses free until November 21

The initiative presents a risk-free way to break into data science and an opportunity to upskill for free

The online educational platform 365 Data Science launches its #21DaysFREE campaign, providing 100% free unlimited access to all its content for three weeks. From November 1 to 21, you can take courses from renowned instructors, complete exams, and earn industry-recognized certificates.


About the Platform

365 Data Science has helped over 2 million students worldwide gain skills and knowledge in data science, analytics, and business intelligence. The program offers an all-encompassing framework for studying data science—whether you’re starting from scratch or looking to upgrade your skills. Students learn with self-paced video lessons and a myriad of exercises and real-world examples. Moreover, 365’s new gamified platform makes the learning journey engaging and rewarding. Providing a theoretical foundation for all data-related disciplines- Probability, Statistics, and Mathematics, the program also offers a comprehensive introduction to R programming, statistics in R, and courses on data visualization in R.


#21DaysFREE Campaign

Until November 21, you can take as many courses as you want and add new tools to your analytics skill set for free. The platform unlocks all 195 hours of video lessons, hundreds of practical exercises, career tracks, exams, and the opportunity to earn industry-recognized certificates. “Starting a career in data science requires devotion and determination. Our mission is to give everyone a chance to get familiar with the field and help them succeed professionally,” says Ned Krastev, CEO of 365 Data Science. This isn’t 365’s first free initiative. The idea of providing unlimited access to all courses was born during the 2020 COVID-19 lockdowns. “We felt it was the right time to open our platform,” adds Ned. “We tried to help people who had lost their jobs or wanted to switch careers to make a transition into data science and analytics.” The free access initiative drove unprecedented levels of engagement, which inspired the 365 team to turn it into a yearly endeavor. Their 2021 campaign, in just one month, generated 80,000 new students (aspiring data scientists and analytics specialists) from 200 countries, who viewed 7.5 million minutes of educational content and earned 35,000 certificates.

While 21 days is not enough to become a fully-fledged professional, the #21DaysFREE initiative provides a risk-free way to familiarize yourself with the industry and lay the foundations of a successful career. Join the program and start for free at  365 Data Science  


Bayesian multilevel modeling in R with brms workshop

Learn how to use Bayesian multilevel modeling in R, while contributing to charity! Join our workshop on Bayesian multilevel modeling in R with brms that is a part of our workshops for Ukraine series. 

Here’s some more info: 
Title: Bayesian multilevel modeling in R with brms

Date: Thursday, November 10th, 18:00 – 20:00 CET (Rome, Berlin, Paris timezone)
Speaker:
Paul Bürkner is a statistician currently working as a Junior Research Group Leader at the Cluster of Excellence SimTech at the University of Stuttgart (Germany). He is interested in a wide range of research topics most of which involve the development, evaluation, implementation, or application of Bayesian methods.  He is the author of the R package brms and member of the Stan Development Team. Previously, Paul studied Psychology and Mathematics at the Universities of Münster and Hagen (Germany) and did his PhD in Münster about optimal design and Bayesian data analysis. He has also worked as a Postdoctoral researcher at the Department of Computer Science at Aalto University (Finland).
Description:
The workshop will be about Bayesian multilevel models and their implementation in R using the package brms. At start there will be a short introduction to multilevel modeling and to Bayesian statistics in general followed by an introduction to Stan, which is an incredibly flexible language to fit open-ended Bayesian models. I will then explain how to access Stan using just basic R formula syntax via the brms package. It supports a wide range of response distributions and modeling options such as splines, autocorrelation, or censoring all in a multilevel context. A lot of post-processing and plotting methods are implemented as well. Some examples from Psychology and Medicine will be discussed.
Minimal registration fee:
20 euro (or 20 USD or 750 UAH)

How can I register?
  • Go to https://bit.ly/3wvwMA6 or  https://bit.ly/3PFxtNA and donate at least 20 euro. Feel free to donate more if you can, all proceeds go directly to support Ukraine.
  • Save your donation receipt (after the donation is processed, there is an option to enter your email address on the website to which the donation receipt is sent)
  • Fill in the registration form, attaching a screenshot of a donation receipt (please attach the screenshot of the donation receipt that was emailed to you rather than the page you see after donation).

If you are not personally interested in attending, you can also contribute by sponsoring a participation of a student, who will then be able to participate for free. If you choose to sponsor a student, all proceeds will also go directly to organisations working in Ukraine. You can either sponsor a particular student or you can leave it up to us so that we can allocate the sponsored place to students who have signed up for the waiting list.

How can I sponsor a student?
  • Go to https://bit.ly/3wvwMA6 or https://bit.ly/3PFxtNA and donate at least 20 euro (or 17 GBP or 20 USD or 750 UAH). Feel free to donate more if you can, all proceeds go to support Ukraine!
  • Save your donation receipt (after the donation is processed, there is an option to enter your email address on the website to which the donation receipt is sent)
  • Fill in the sponsorship form, attaching the screenshot of the donation receipt (please attach the screenshot of the donation receipt that was emailed to you rather than the page you see after the donation). You can indicate whether you want to sponsor a particular student or we can allocate this spot ourselves to the students from the waiting list. You can also indicate whether you prefer us to prioritize students from developing countries when assigning place(s) that you sponsored.

If you are a university student and cannot afford the registration fee, you can also sign up for the waiting list here. (Note that you are not guaranteed to participate by signing up for the waiting list).

You can also find more information about this workshop series,  a schedule of our future workshops as well as a list of our past workshops which you can get the recordings & materials of here.
Looking forward to seeing you during the workshop!

How do I count thee? Let me count the ways?

How do I count thee? Let me count the ways? by Jerry Tuttle    In Major League Baseball, a player who hits 50 home runs in a single season has hit a lot of home runs. Suppose I want to count the number of 50 homer seasons by team, and also the number of 50 homer seasons by New York Yankees. (I will count Maris and Mantle in 1961 as two.) Here is the data including Aaron Judge’s 62 in 2022 :
You would think base R would have a count function such as count(df$Team) and count(df$Team == “NYY”) but this gives the error “could not find function ‘count'”. Base R does not have a count function. Base R has at last four ways to perform a count: 1. The table function will count items in a vector.    table(df$Team) presents results horizontally, and data.frame(table(df$Team)) presents results vertically.    table(df$Team == “NYY”) displays results 37 false and 10 true, while table(df$Team == “NYY”)[2] just displays the result 10 true. 2. The sum function can be used to count the number of rows meeting a condition.    sum(df$Team == “NYY”) displays the result 10. Here df$Team == “NYY” is creating a logical vector, and sum is summing the number of true = 1. 3. Similar to sum, nrow(df[df$Team == “NYY”, ]) counts the number of rows meeting the NYY condition. 4. The length function counts the number of elements in an R object.    length(which(df$Team == “NYY”)) , length(df$Team[df$Team == “NYY”]) , and length(grep(“NYY”, df[ , “Team”])) are all ways that will count the 10 Yankees. The more direct solution to counting uses the count function in the dplyr library. Note that dplyr’s count function applies to a data frame or tibble, but not to a vector. After loading library(dplyr) , 1. df %>% count(Team) lists the count for each team. 2. df %>% filter(Team = “NYY”) lists each Yankee, and you can see there are 10. 3. df %>% count(Team == “NYY”) displays 37 false and 10 true, while df %>% filter(Team == “NYY”) %>% count() just displays the 10 true. The following is a bar chart of the results by team for teams with at least 1 50 homer season:
Finally, “How do I count thee? Let me count the ways?” is of course adapted from Elizabeth Barrett Browning’s poem “How do I love thee? Let me count the ways?” But in her poem, just how would we count the number of times “love” is mentioned? The tidytext library makes counting words fairly easy, and the answer is ten, the same number of 50 homer Yankee seasons. Coincidence? The following is all the R code. Happy counting!

  library(dplyr) 
library(ggplot2)
library(tidytext)
df <- data.frame(
   Player=c('Ruth','Ruth','Ruth','Ruth','Wilson','Foxx','Greenberg','Foxx','Kiner','Mize','Kiner','Mays','Mantle','Maris', 'Mantle','Mays','Foster','Fielder','Belle','McGwire','Anderson','McGwire','Griffey','McGwire','Sosa','Griffey', 'Vaughn','McGwire','Sosa','Sosa','Bonds','Sosa','Gonzalez','Rodriguez','Rodriguez','Thome','Jones','Howard','Ortiz', 'Rodriguez','Fielder','Bautista','Davis','Stanton','Judge','Alonso','Judge'),
   Year=c(1920,1921,1927,1928,1930,1932,1938,1938,1947,1947,1949,1955,1956,1961,1961,1965,1977,1990,1995,1996,1996,1997,1997, 1998,1998,1998,1998,1999,1999,2000,2001,2001,2001,2001,2002,2002,2005,2006,2006,2007,2007,2010,2013,2017,2017,2019,2022),
   Homers=c(54,59,60,54,56,58,58,50,51,51,54,51,52,61,54,52,52,51,50,52,50,58,56,70,66,56,50,65,63,50,73,64,57,52,57,52,51, 58,54,54,50,54,53,59,52,53,62),
   Team=c('NYY','NYY','NYY','NYY','CHC','PHA','DET','BOS','PIT','NYG','PIT','NYG','NYY','NYY','NYY','SF','CIN','DET','CLE', 'OAK','BAL','OAK/SLC','SEA','SLC','CHC','SEA','SD','SLC','CHC','CHC','SF','CHC','ARI','TEX','TEX','CLE','ATL','PHP', 'BOR','NYY','MIL','TOR','BAL','MIA','NYY','NYM','NYY')) head(df) # base R ways to count: table(df$Team)    # shows results horizontally
data.frame(table(df$Team))    #shows results vertically
table(df$Team == "NYY")    # displays 37 false and 10 true
table(df$Team == "NYY")[2] sum(df$Team == "NYY")    # displays the result 10. nrow(df[df$Team == "NYY", ])    # counts the number of rows meeting the NYY condition. length(which(df$Team == "NYY"))     # which returns a vector of indices which are true
length(df$Team[df$Team == "NYY"])
length(grep("NYY", df[ , "Team"]))     # grep returns a vector of indices that match the pattern # dplyr R ways to count; remember to load library(dplyr): df %>% count(Team)    # lists the count for each team. df %>% filter(Team == "NYY")    # lists each Yankee, and you can see there are 10. df %>% count(Team == "NYY")    # displays 37 false and 10 true, while
df %>% filter(Team == "NYY") %>% count()    # just displays the 10 true. # barplot of all teams with at least 1 50 homer season; remember to load library(ggplot2) df %>%
    group_by(Team) %>%
    summarise(count = n()) %>%
    ggplot(aes(x=reorder(Team, count), y=count, fill=Team)) +
    geom_bar(stat = 'identity') +
    ggtitle("Count of 50 Homer Seasons") +
    xlab("Team") +
    scale_y_continuous(breaks=c(1,2,3,4,5,6,7,8,9,10)) +
    coord_flip() +
    theme(plot.title = element_text(face="bold", size=18)) +
    theme(axis.title.y = element_text(face="bold")) +
    theme(axis.title.x = element_blank()) +
    theme(axis.text.x = element_text(size=12, face="bold"),
    axis.text.y = element_text(size=12, face="bold")) +
    theme(legend.position="none")
# count number of times "love" is mentioned in Browning's poem; remember to load library(tidytext) textfile <- c("How do I love thee? Let me count the ways.",
"I love thee to the depth and breadth and height",
"My soul can reach, when feeling out of sight",
"For the ends of being and ideal grace.",
"I love thee to the level of every day's",
"Most quiet need, by sun and candle-light.",
"I love thee freely, as men strive for right.",
"I love thee purely, as they turn from praise.",
"I love thee with the passion put to use", <br
"In my old griefs, and with my childhood's faith.",
"I love thee with a love I seemed to lose",
"With my lost saints. I love thee with the breath,", <br
"Smiles, tears, of all my life; and, if God choose,",
"I shall but love thee better after death.")
df<-data.frame(line=1:length(textfile), text=textfile) <br <br
df_words % unnest_tokens(word, text) <br
cleaned_words % anti_join(get_stopwords())
cleaned_words %>% count(word, sort = TRUE) %>% head(6)
cleaned_words %>% filter(word == "love") %>% count()