Classification modeling in R for profitable decisions workshop

Learn classification modeling to improve your decision-making for your business or use these skills for your research in our 2-part workshop! These workshops are a part of our workshops for Ukraine series, and all proceeds from these workshops go to support Ukraine. You can find more information about other workshops, as well as purchase recordings of the previous workshops here.

In the first part of the workshop titled Classification modeling for profitable decisions, which will take place online on Thursday, October 20th, 18:00 – 20:00 CET, we will cover the theoretical framework that you need to know to perform classification analysis and cover the key concepts. 

The second part of the workshop that will take place on Thursday, October 27th, 18:00 – 20:00 CET will include hands-on practice in R, so that you can learn how to implement the concepts covered in the first part in R. 

You can register for each part separately, so you can choose whether you wish to attend both parts or just part 1 or part 2.   Below you can find more information about each part and how to register for it: 

PART 1
Title: Classification modeling for profitable decisions: Theory and a case study on firm defaults. 
Date:
Thursday, October 20th, 18:00 – 20:00 CET (Rome, Berlin, Paris timezone)
Speaker:
Gábor Békés is an Assistant Professor at the Department of Economics and Business of Central European University, a research fellow at KRTK in Hungary, and a research affiliate at CEPR. His research is focused on international economics; economic geography and applied IO, and was published among others by the Global Strategy Journal, Journal of International Economics, Regional Science and Urban Economics or Economic Policy and have authored commentary on VOXEU.org. His comprehensive textbook, Data Analysis for Business, Economics, and Policy with Gábor Kézdi was publsihed by Cambridge University Press in 2021. 
Description:
This workshop will introduce the framework and methods of probability prediction and classification analysis for binary target variable. We will discuss the key concepts such as probability prediction, classification threshold, loss function, classification, confusion table, expected loss, the ROC curve, AUC and more. We will use logit models as well as random forest to predict probabilities and classify. In the workshop we will focus on a case study on firm defaults using a dataset on financial and management features of firms. The workshop material is based on a chapter and a case study from my textbook. Code in R and Python are available from the Github repo, and the data is available as well. The workshop will introduce key concepts, but the focus will be on data wrangling and modelling decisions we make for a real life problem. There will be a follow-up workshop focusing on the coding side of the case study. 
Minimal registration fee:
20 euro (or 20 USD or 750 UAH)
Suggested registration fee for professionals:
50 euro (if you can afford it, our suggested registration fee for this workshop is 50 euro. If you cannot afford it, you can still register by donating 20 euro).

Remember that you can register even if you will not be able to attend in person as all registered participants will get a recording.

How can I register?
  • Go to https://bit.ly/3wvwMA6 or https://bit.ly/3PFxtNA and donate at least 20 euro. Feel free to donate more if you can, all proceeds go to support Ukraine!
  • Save your donation receipt (after the donation is processed, there is an option to enter your email address on the website to which the donation receipt is sent)
  • Fill in the registration form, attaching a screenshot of a donation receipt (please attach the screenshot of the donation receipt that was emailed to you rather than the page you see after donation).

If you are not personally interested in attending, you can also contribute by sponsoring a participation of a student, who will then be able to participate for free. If you choose to sponsor a student, all proceeds will also go directly to organisations working in Ukraine. You can either sponsor a particular student or you can leave it up to us so that we can allocate the sponsored place to students who have signed up for the waiting list.

How can I sponsor a student?
  • Go to https://bit.ly/3wvwMA6 or https://bit.ly/3PFxtNA and donate at least 20 euro (or 17 GBP or 23 USD or 660 UAH). Feel free to donate more if you can, all proceeds go to support Ukraine!
  • Save your donation receipt (after the donation is processed, there is an option to enter your email address on the website to which the donation receipt is sent)
  • Fill in the sponsorship form, attaching the screenshot of the donation receipt (please attach the screenshot of the donation receipt that was emailed to you rather than the page you see after the donation). You can indicate whether you want to sponsor a particular student or we can allocate this spot ourselves to the students from the waiting list. You can also indicate whether you prefer us to prioritize students from developing countries when assigning place(s) that you sponsored.

If you are a university student and cannot afford the registration fee, you can also sign up for the waiting list here. (Note that you are not guaranteed to participate by signing up for the waiting list).


PART 2
Title: Classification modelling for profitable decisions: Hands on practice in R
Date:
Thursday, October 27th, 18:00 – 20:00 CET (Rome, Berlin, Paris timezone)
Speaker:
Ágoston Reguly is a Postdoctoral Fellow at the Financial Services and Innovation Lab of Scheller College of Business, Georgia Institute of Technology. His research is focused on causal machine learning methods and their application in corporate finance. He obtained his Ph.D. degree from Central European University (CEU), where he has taught multiple courses such as data analysis, coding, and mathematics. Before CEU he worked for more than three years at the Hungarian Government Debt Management Agency.
Description:
This workshop will implement methods of probability prediction and classification analysis for the binary target variable. This workshop is a follow-up to Gábor Békés’s workshop on the key concepts and (theoretical) methods for the same subject. We will use R via RStudio to apply probability prediction, classification threshold, loss function, classification, confusion table, expected loss, the ROC curve, AUC, and more. We will use linear probability models, logit models as well as random forests to predict probabilities and classify. In the workshop, we follow the case study on firm defaults using a dataset on financial and management features of firms. The workshop material is based on a chapter and a case study from the textbook of Gábor Békés and Gábor Kézdi (2021): Data Analysis for Business, Economics, and Policy, Cambridge University Press. The workshop will not only implement the key concepts, but the focus will be on data wrangling and modeling decisions we make for a real-life problem. Minimal registration fee: 20 euro (or 20 USD or 750 UAH) Suggested registration fee for professionals: 50 euro (if you can afford it, our suggested registration fee for this workshop is 50 euro. If you cannot afford it, you can still register by donating 20 euro).

How can I register?
  • Go to https://bit.ly/3wvwMA6 or https://bit.ly/3PFxtNA and donate at least 20 euro. Feel free to donate more if you can, all proceeds go to support Ukraine!
  • Save your donation receipt (after the donation is processed, there is an option to enter your email address on the website to which the donation receipt is sent)
  • Fill in the registration form, attaching a screenshot of a donation receipt (please attach the screenshot of the donation receipt that was emailed to you rather than the page you see after donation).

How can I sponsor a student?
  • Go to https://bit.ly/3wvwMA6 or https://bit.ly/3PFxtNA and donate at least 20 euro (or 17 GBP or 23 USD or 660 UAH). Feel free to donate more if you can, all proceeds go to support Ukraine!
  • Save your donation receipt (after the donation is processed, there is an option to enter your email address on the website to which the donation receipt is sent)
  • Fill in the sponsorship form, attaching the screenshot of the donation receipt (please attach the screenshot of the donation receipt that was emailed to you rather than the page you see after the donation). You can indicate whether you want to sponsor a particular student or we can allocate this spot ourselves to the students from the waiting list. You can also indicate whether you prefer us to prioritize students from developing countries when assigning place(s) that you sponsored.

If you are a university student and cannot afford the registration fee, you can also sign up for the waiting list here. (Note that you are not guaranteed to participate by signing up for the waiting list).

Looking forward to seeing you during the workshop!

Access Datacamp’s top programming courses for only $1 this week!


Running only until Oct. 7, DataCamps’ entire learning platform is accessible for just $1 during Space Week!
Suitable for complete beginners and seasoned practitioners alike, DataCamp’s hands-on learning approach has something for anyone looking to advance their data skills. With unlimited access to 380+ courses in Python, R, SQL, Power-bi and more for only $1—you can start coding and applying your skills in real-world situations from day one, regardless of your starting point. And, once you’ve mastered certain skills, we offer industry-leading certifications to help boost your career and get recognised by recruiters. As data becomes more prominent in our daily and working lives, possessing the skills to effectively use and manipulate data puts you at an instant advantage. In fact, 82% of leaders expect all employees to have basic data literacy skills (Tableau, 2022)—and it’s only going to increase. For less than a price of coffee, dive into data. Your future self will thank you. Buy Now *note: First month is charged at $1, after which you will be billed monthly at our standard rate. Cancel any time.

TidyFinance: Empirical asset pricing in R workshop

Learn how to do empirical asset pricing in R, while contributing to charity! Join our workshop on TidyFinance: Empirical asset pricing in R which is a part of our workshops for Ukraine series. 

Here’s some more info: 
Title: TidyFinance: Empirical asset pricing in R
Date:
Thursday, October 13th 18:00 – 20:00 CEST (Rome, Berlin, Paris timezone)
Speaker:
Patrick Weiss, PhD, CFA is a postdoctoral researcher at Vienna University of Economics and Business. Jointly with Christoph Scheuch and Stefan Voigt, Patrick wrote the open-source book www.tidy-finance.org , which serves as the basis for this workshops. Visit his webpage for additional information.
Description:
This workshop explores empirical asset pricing and combines explanations of theoretical concepts with practical implementations. The course relies on material available on www.tidy-finance.org and proceeds in three steps: (1) We dive into the most used data sources and show how to work with data from WRDS, forming the basis for the analysis. We also briefly introduce some other possible sources of financial data. (2) We show how to implement the capital asset pricing model in rolling-window regressions. (3) We introduce the widely used method of portfolio sorts in empirical asset pricing. During the workshop, we will combine some theoretical insights with hands-on implementations in R.


How can I register?

  • Go to https://bit.ly/3PFxtNA and donate at least 20 euro. Feel free to donate more if you can, all proceeds go directly to support Ukraine.
  • Save your donation receipt (after the donation is processed, there is an option to enter your email address on the website to which the donation receipt is sent)
  • Fill in the registration form, attaching a screenshot of a donation receipt (please attach the screenshot of the donation receipt that was emailed to you rather than the page you see after donation).

If you are not personally interested in attending, you can also contribute by sponsoring a participation of a student, who will then be able to participate for free. If you choose to sponsor a student, all proceeds will also go directly to organisations working in Ukraine. You can either sponsor a particular student or you can leave it up to us so that we can allocate the sponsored place to students who have signed up for the waiting list.

How can I sponsor a student?
  • Go to https://bit.ly/3PFxtNA and donate at least 20 euro (or 17 GBP or 20 USD or 750 UAH). Feel free to donate more if you can, all proceeds go to support Ukraine!
  • Save your donation receipt (after the donation is processed, there is an option to enter your email address on the website to which the donation receipt is sent)
  • Fill in the sponsorship form, attaching the screenshot of the donation receipt (please attach the screenshot of the donation receipt that was emailed to you rather than the page you see after the donation). You can indicate whether you want to sponsor a particular student or we can allocate this spot ourselves to the students from the waiting list. You can also indicate whether you prefer us to prioritize students from developing countries when assigning place(s) that you sponsored.

If you are a university student and cannot afford the registration fee, you can also sign up for the waiting list here. (Note that you are not guaranteed to participate by signing up for the waiting list).

You can also find more information about this workshop series,  a schedule of our future workshops as well as a list of our past workshops which you can get the recordings & materials of here.
Looking forward to seeing you during the workshop!
DataCamp Recruit: A better way to hire data professionals

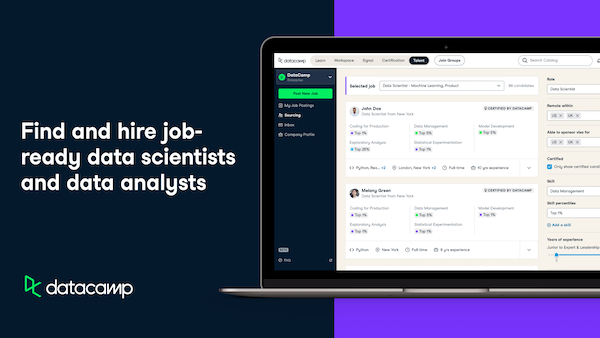
DataCamp Recruit is built to help you find, hire and scale industry leading data teams. The platform provides access to one of the largest sources of certified data professionals, with clear insights into the precise skills, experience, and expertise that you need to hire for.

Why we launched DataCamp Recruit 

The demand for data professionals has never been higher, while the supply of qualified candidates remains low. On top of that, the difficulty around testing for technical skills makes hiring data professionals one of the most arduous roles for a recruiter.

With DataCamp Recruit, we provide recruiters with access to not only one of the largest sources of job-ready data professionals, but also clear insights into the technical abilities of each candidate. With our easy to use filters, you can get to the right hire faster.

What can DataCamp Recruit do for you? 

It can take months to find and hire the right data professional, but with DataCamp Recruit we get you there in minutes. 

Data professionals on DataCamp have a diverse set of experience and backgrounds. Through our filtering tool, you can match with candidates and skill sets that you need to hire for. This saves you time, and gives you clear insights into their skills, helping you to hire with confidence.  

DataCamp’s content and curriculum are designed by leaders in data science, so candidates are equipped with up-to-date technical skills making them ready to work from day one.

Plus you can hire candidates certified by our #1 ranked certification program (Forbes, 2022). Candidates certified by DataCamp are not only tested for their technical skills, but also on their soft skills such as their ability to translate data into insight, while communicating effectively.

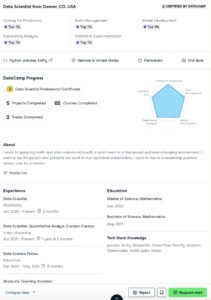
Professionals on DataCamp Recruit are ranked across six key categories:

    • Data management
    • Exploratory analysis
    • Statistical experimentation
    • Model development
    • Coding in production environments
    • Communication

What candidate profiles on DataCamp Recruit look like:


Check out our short demo to get an idea of how to use DataCamp Recruit

[youtube https://www.youtube.com/watch?v=XWeMz4M0a8Q&w=560&h=315]

Get Started with Recruit

Like what you see? Get started with Recruit today for free, or request a free demo to find out more about the platform.


Fundamentals of Exploratory and Inferential Spatial Data Analysis in R workshop

Learn how to work with Spatial Data in R, while contributing to charity! Join our workshop on Fundamentals of Exploratory and Inferential Spatial Data Analysis in R which is a part of our workshops for Ukraine series. 

Here’s some more info: 

Title: Fundamentals of Exploratory and Inferential Spatial Data Analysis in R
Date: 
Thursday, September 13th, 18:00 – 20:00 CEST (Rome, Berlin, Paris timezone)
Speaker:
Denys Dukhovnov, Ph.D. student in Demography at University of California, Berkeley. His research revolves around small-area estimation and geographic inequalities in mortality in the United States. He holds a previous M.A. degree in Data Analytics and Applied Social Research, held multiple research positions in social science fields, and currently works as a researcher at the Human Mortality Database (HMD).
Description:
This workshop will provide a hands-on overview of the exploratory and inferential spatial data analysis in R. The attendees will become familiar with statistical concepts of spatial adjacency and dependence and with various methods of measuring it (using such indicators as Moran’s I, Geary’s C, LISA/ELSA plots, etc.), as well as with statistical challenges of working with spatial data (e.g. modifiable areal unit problem or MAUP). In addition, the workshop will provide a foundational overview of inferential spatial analysis, specifically through the application of the basic types of spatial econometric regression models (SAR, SLX, SEM models). An emphasis will be made on the interpretation and reporting of the model performance and results. Prior familiarity with spatial data types and OLS regression is helpful, but not necessary.

How can I register?
  • Go to https://bit.ly/3wvwMA6 or  https://bit.ly/3PFxtNA and donate at least 20 euro. Feel free to donate more if you can, all proceeds go directly to support Ukraine.
  • Save your donation receipt (after the donation is processed, there is an option to enter your email address on the website to which the donation receipt is sent)
  • Fill in the registration form, attaching a screenshot of a donation receipt (please attach the screenshot of the donation receipt that was emailed to you rather than the page you see after donation).

If you are not personally interested in attending, you can also contribute by sponsoring the participation of a student, who will then be able to participate for free. If you choose to sponsor a student, all proceeds will also go directly to organizations working in Ukraine. You can either sponsor a particular student or you can leave it up to us so that we can allocate the sponsored place to students who have signed up for the waiting list.

How can I sponsor a student?
  • Go to https://bit.ly/3wvwMA6 or https://bit.ly/3PFxtNA and donate at least 20 euro (or 17 GBP or 20 USD or 750 UAH). Feel free to donate more if you can, all proceeds go to support Ukraine!
  • Save your donation receipt (after the donation is processed, there is an option to enter your email address on the website to which the donation receipt is sent)
  • Fill in the sponsorship form, and attaching the screenshot of the donation receipt (please attach the screenshot of the donation receipt that was emailed to you rather than the page you see after the donation). You can indicate whether you want to sponsor a particular student or we can allocate this spot ourselves to the students from the waiting list. You can also indicate whether you prefer us to prioritize students from developing countries when assigning place(s) that you sponsored.

You can also find more information about this workshop series,  a schedule of our future workshops as well as a list of our past workshops which you can get the recordings & materials of here.

Looking forward to seeing you during the workshop!
How to generate data from a model – Part 1


Summary

Traditionally, data scientists have built models based on data. This article details how to do the exact opposite i.e. generate data based on a model. This article is first in the series of articles on building data from model. 


Motivation & Practical Applications

Businesses across various industry domains are embracing Artificial Intelligence(AI) and Machine Learning(ML) driven solutions. Furthermore, it is observed that the recent increase in the cloud based Machine Learning Operations (ML Ops) tools such Azure ML has made AI/ML solutions relatively more accessible,  easy to deploy and in some cases more affordable. Additionally, it is also observed that there is an increase in the usage of Auto ML & feature engineering packages. These approaches reduce manual intervention during model build and retraining stages.  Since the focus is predominantly on building ML pipelines as opposed to the traditional approach of building models manually, the robustness of the pipelines needs to be inspected. This is still an evolving field and currently is being handled by model observability tools. This article proposes one such method of observability. The purpose of this method can be best represented in the form of a question as given below.

What if we built the underlying data distributions, the outliers, the dependent variable and then put it through the ML Ops pipeline?  Wouldn’t we know where the pipeline worked well and where it could have done better?
This question motivated the build of a Software as a Service (SaaS) product called uncovr. This product can now be accessed through an R package conjurer by following the steps outlined below.


Data from Model Using R

Step 1: Register for the API

    • Head over to the API developer portal at (https://foyi.developer.azure-api.net/).
    • Click on the Sign up button on the home page.
    • Register your details such as email, password etc.
    • You will receive an email to verify your email id.
    • Once you verify your email id, your account will be setup and you will receive a confirmation email.
    • Once your account is set up, please head over to the products section on the developer portal and select the product starter. Currently, this is the only subscription available. Give your subscription a name, read and accept the terms and click Subscribe
    • On your profile page, under the subscriptions section, click on show next to the Primary key. That is the subscription key you will need to access the API.

Step 2: Install R Package Conjurer

Install the latest version of the package from CRAN as follows.
install.packages("conjurer")

Step 3: Generate data

Generate the data using the code below.

library(conjurer)
uncovrJson <- buildModelData(numOfObs = 1000, numOfVars = 3, key = "input your subscription key here")
df <- extractDf(uncovrJson=uncovrJson)

The above code has two steps. The first step is to connect to the API and source the data in JSON  format. The second step is to convert the JSON format to an R dataframe.

The components of the function buildModelData are as follows.
    • numOfObs is the number of observations i.e. rows of data that you would like to generate. Please note that the current version allows you to generate from a minimum of 100 observations to a maximum of 10,000. 
    • numOfVars is the number of independent variables i.e. columns in the data. Please note that the current version allows you to generate from a minimum of 1 variable to a maximum of 100.
    • key is the Primary key that you have sourced from the earlier step.
The data frame df (in the code above) will have three columns with the names iv1, iv2, iv3 and one column dv. The columns with prefix iv are the independent variables while the dv is the dependent variable. You can rename them to suit your needs. 
The model used in the current version to generate the data is a linear regression model. The details of the model formula and its estimated performance can be inspected as follows. 
    • To begin with, you can inspect the JSON data that is received from the API by using the code  str(uncovrJson). This should display all the components of the JSON file. The attributes prefixed as slope are the coefficients of the model formula corresponding to the number. For example, slope1 is the coefficient corresponding to iv1 i.e. independent variable 1. 
    • The regression formula used to construct the data for the example data frame is as follows.
      Please note that the formula takes the form of Y = mX + C.
      dv = intercept + (slope1*iv1) + (slope2*iv2) + (slope3*iv3) + error.
    • Please note that while the slopes i.e. the coefficients are at variable level, the error is at each observation level. These errors can be accessed as uncovrJson$error

Concluding Remarks

The underlying API uncovr is under development and as new functionality is released, the R package conjurer will be updated to reflect those changes. For any feature requests or bug reports, please follow the contribution guidelines on GitHub repository. If you would like to follow the future releases and news, please follow our LinkedIn page.

Learn data skills, earn points and win money prizes daily with Datacamp!

tl;dr

Get a chance to win up to $1500* by simply learning data science on the DataCamp platform. Until Aug 31, the amount of XP you earn will determine the amount of cash money you can win—every day. Start learning for Free
Learn More.

Details

DataCamp is one of the world’s leading data science learning platforms, here is why! ● Over 10 Million users trust DataCamp
● An average course rating of 4.5/5 stars
● 6x better completion rates than any other platform
● 80% of the Fortune 1000 use DataCamp to upskill their teams, including Google

DataCamp’s gamified learning experience ensures learners enjoy upskilling in data. And for a limited time only, they’ve made the experience rewarding too! Get a chance to win up to $1500* by simply learning data science on the DataCamp platform. Until Aug 31, the amount of XP you earn will determine the amount of cash money you can win—every day. Start learning for Free *Rules of the XP Learner Challenge:
Earn XP to win cash. Every right answer you get increases your chances of winning a prize.
Daily XP Challenge – Win $500
○ Cash prize for the learner with the highest XP in a day
○ XP daily volume to be measured between 12:01 AM to 11:59 PM EST
○ 17 chances to win cash prizes between Aug 15-31
○ 1 catch – 1 prize per individual, you can’t win multiple days Ultimate Prize – Win $1000
○ Cash prize for the ultimate learner with the highest single day XP through Aug 15-31
○ Only awarded on Sept 1 based on results

Learn More

Time to upskill in R? EARL’s workshop lineup has something for every data practitioner.

It’s well-documented that data skills are in high demand, making the industry even more competitive for employers looking for experienced data analysts, data scientists and data engineers – the fastest-growing job roles in the UK. In support of this demand, it’s great to see the government taking action to address the data skills gap as detailed in their newly launched Digital Strategy.

The range of workshops available at EARL 2022 is designed to help data practitioners extend their skills via a series of practical challenges. Led by specialists in Shiny, Purrr, Plumber, ML and time series visualisation, you’ll leave with tips and skills you can immediately apply to your commercial scenarios.

The EARL workshop lineup.


Time Series Visualisation in R.

How does time affect our perception of data? Is the timescale important? Is the direction of time relevant? Sometimes cumulative effects are not visible with traditional statistical methods, because smaller increments stay under the radar. When a time component is present, it’s likely that the current state of our problem depends on the previous states. With time series visualisations we can capture changes that may otherwise go undetected. Find out more.

Explainable Machine Learning.

Explaining how your ML products make decisions empowers people on the receiving end to question and appeal these decisions. Explainable AI is one of the many tools you need to ensure you’re using ML responsibly. AI and, more broadly, data can be a dangerous accelerator of discrimination and biases: skin diseases were found to be less effectively diagnosed on black skin by AI-powered software, and search engines advertised lower-paid jobs to women. Staying away from it might sound like a safer choice, but this would mean missing out on the huge potential it offers. Find out more.

Introduction to Plumber APIs.

90% of ML models don’t make it into production. With API building skills in your DS toolbox, you should be able to beat this statistic in your own projects. As the field of data science matures, much emphasis is placed on moving beyond scripts and notebooks and into software development and deployment. Plumber is an excellent tool to make the results from your R scripts available on the web. Find out more.

Functional Programming with Purrr.

Iteration is a very common task in Data Science. A loop in R programming is of course one option – but purrr (a package from the tidyverse) allows you to tackle iteration in a functional way, leading to cleaner and more readable code. Find out more.

How to Make a Game with Shiny.

Shiny is only meant to be used to develop dashboards, right? Or is it possible to develop more complex applications with Shiny? What would be the main limitations? Could R and Shiny be used as a general-purpose framework to develop web applications? Find out more.

Sound interesting? Check out the full details – our workshops spaces traditionally go fast so get yourself and your team booked in while there are still seats available. Book your Workshop Day Pass tickets now.

Charity R Workshops in support of Ukraine

Learn R (as well as Python and other tools for data analysis) and contribute to charity at the same time. 

Since April, we have been running a series of weekly workshops on R and other tools for data analysis, all proceeds from which go to support Ukraine. Our workshops cover topics for people with different prior levels of experience in R: from complete beginners to experienced users. All workshops are recorded, so you can register even if you are not able to attend in person!

Introduction to R Shiny

Our next workshop on R will take place on August 4th and will cover Introduction to R Shiny.  You will (a) learn how to set up basic statistical simulations, (b) learn how to create data-based applications, and (c) cover the nuts and bolts of the user interface in Shiny.

To register you can donate 20 euros here or here and fill in this registration form, attaching the donation confirmation which will be emailed to you. If you are a student who is not able to pay the registration fee, you can sign up for the waiting list here. If you are not interested in this workshop but would like to support us, make a donation & support students in learning, you can sponsor a student by donating 20 euros per student here or here and filling in this form. You can read more about this workshop here.


Introduction to Quarto

We also will have a workshop on Introduction to Quarto on August 11th. You will learn how to create and publish documents using Quarto, a modern platform for creating professional articles, slide decks, websites, and other publications. By way of an introductory example, participants will be walked through the process of crafting and publishing their own personal professional website.

To register you can donate 20 euros here or here  and fill in this registration form, attaching the donation confirmation which will be emailed to you. If you are a student who is not able to pay the registration fee, you can sign up for the waiting list here. If you are not interested in this workshop but would like to support us, make a donation & support students in learning, you can sponsor a student by donating 20 euros per student here or here and filling in this form. You can read more about this workshop here.

Previous workshops

If you make a donation, you can also get recordings and materials of any of our previous workshops. We have a wide range on workshops in R available from Introduction to R in Tidyverse and Data Visualization with ggplot to Text Data Analysis in R, Web Scraping in R and Introduction to Spatial Data Analysis in R. You can read more information about all of our past workshops and find out how to get access to the recordings and the materials here (scroll to ‘previous workshops’ section).

More information

You can find more information about any of our upcoming workshops here. You can also subscribe to our mailing list to get updates about the future workshops here. If you experience any issues with registration process or have any questions or suggestions, feel free to email me at [email protected]

Refine your R Skills with Free Access to DataCamp

Introducing Free Week 

DataCamp is excited to announce their Free Week commencing Monday, 18 July at 8 AM ET. Anyone interested in developing their R programming skills or improving their data literacy can enjoy unlimited free access for a week until 24 July at 11:59 PM. 

For those who are new to R or are supporting teams using R, now is the time to dig deeper into the programming language. DataCamp offers R courses from introductory courses to more advanced topics, meaning you’ll find learning opportunities no matter your level. 

Free Access for Individuals 

To access DataCamp Free Week for individuals, you’ll only need your email address when signing up on their Free Week page.
Once you’ve signed up, you will have access to their entire library of 387 courses, 83 projects, 55 practice sessions, and 15 assessments across Python, R, SQL, Power BI, Tableau, and more. If you are an R loyalist, you’ll be happy to hear about our 149 courses specializing in your favorite programming language.
Free Week access for individuals starts at 8 am ET on 18 July and finishes at 11.59 pm ET on 24 July. 
Not only that, but to ensure you finish the week off with confidence, you also have access to the following resources:

Moreover, for their intermediate and advanced learners solely interested in developing your R skills, their skill and career tracks are perfect for you. They have skill and career tracks specially curated for developing R programming skills where you get to develop your knowledge in the following areas:

Free Access for Teams

DataCamp recognizes and appreciates the increasing dependence that companies have on data-driven decisions. With that, we created DataCamp for Business to help businesses upskill their workforce to become data-driven.
In DataCamp for Business, you and your team will have access to the following resources:
  • Build learning programs with their team to create custom learning paths just for your team (eg. if your team specializes in R, their team will help create R-specialized learning pathways)
  • Report on your ROI using DataCamp’s visualization and spreadsheet tools to thoroughly understand your team’s progress
  • Upskill your company by investing in professional development for all roles and skill levels
  • Get started and scale using DataCamp’s integrations

If you want to start developing your team today, sign up to DataCamp Teams during Free Week, and gain seven days of free access from the point of sign up. 
You will receive seven days’ free access from the point of sign-up, and your payment will automatically renew after that period. 
We cannot wait for you to join them along with 2,500 other companies that have upskilled their team with DataCamp. They are proud to have a diverse list of clients, including top companies from consulting, the FTSE 1000, and 180+ government agencies.