365 Data Science opens its doors this November!
From November 1 to November 21, 2024 (8 a.m. UTC), enjoy unrestricted access to its entire platform, including a selection of R programming courses and projects.
This offer includes expert-led courses, hands-on projects, and interactive exercises on various data science and AI topics. With flexible, 24/7 access, learners can study at their own pace—making it an excellent opportunity to advance in these fields.
The Initiative’s Fourth and Biggest Year
As 2024 unfolds, 365 Data Science’s free access initiative enters its fourth consecutive year, reinforcing its dedication to democratizing data science education. This program—which emerged as a response to global lockdowns—has become a pivotal annual event in the data science community.
CEO Ned Krastev emphasizes the initiative’s alignment with industry trends: “As data science continues to shape our world, we’re committed to equipping learners with cutting-edge skills and knowledge.”
The 2023 edition saw remarkable engagement, with over 75,000 participants collectively spending over 3.6 million minutes on the platform and earning over 17,000 certificates. Krastev adds, “The consistent engagement each year reflects a global hunger for knowledge and skills in data science. We’re proud to support learners on their journey to excellence in this field.”
Boost Your Career with Professional Certifications
365 Data Science empowers learners to translate their newly acquired knowledge into tangible career advancements by offering free, authenticated proof of expertise—narrowing the divide between educational achievement and industry recognition.
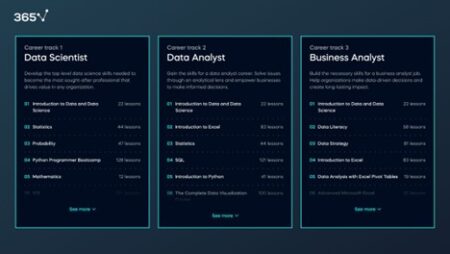
The program offers diverse certifications encompassing broad career trajectories and niche specializations. These credentials can bolster participants’ profiles in the ever-evolving data science landscape.
And these certifications are just the beginning of what 365 Data Science offers for free.
R Programming: A Core Focus
365 Data Science recognizes R’s pivotal role in data analysis and visualization, as evidenced by their tailored course offerings:
- Introduction to R Programming: This foundational course covers syntax, data structures, and basic operations, setting the stage for your R journey.
- The Complete Data Visualization Course with Python, R, Tableau, and Excel: While comprehensive in scope, this course significantly emphasizes R’s powerful visualization capabilities.
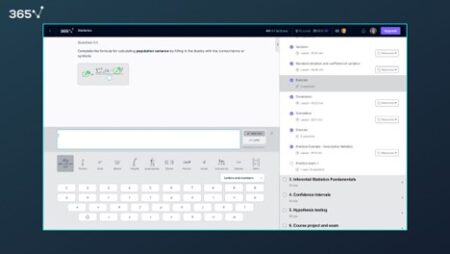
You can also find other vital courses to enhance your use of R and other programming languages, including Statistics, Probability, Statistical Tests in Sales and Marketing, Data Preprocessing, and more.
Comprehensive Learning Experience
While R programming is one of their focuses, 365 Data Science offers a wide array of courses covering various aspects of data science and AI:
- Foundational Skills: Courses in data literacy, strategy, math, and more to build a solid analytical base
- Programming Languages: Comprehensive courses in Python and SQL to complement your R skills
- Machine Learning: From basic concepts to advanced algorithms and deep learning
- Artificial Intelligence: Cutting-edge AI topics, including natural language processing and generative AI
- Business Applications: Courses that bridge the gap between technical skills and real-world business scenarios
These diverse offerings ensure a well-rounded education in data science and AI.
Beyond Courses: Hands-On Projects & Career Prep
Theory alone isn’t enough in data science. 365 Data Science offers practical projects that let you apply your R skills to real-world scenarios. A standout example includes the Housing Market Data Analysis in R Project, where you’ll use R to dissect and interpret housing market trends. But there is far more to explore on their website.
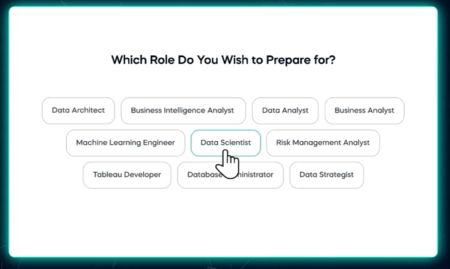
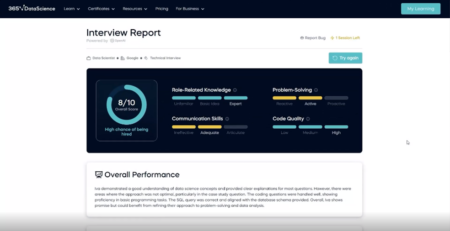
Mastering technical skills is just one part of pursuing a data science or AI career. You also need to articulate your knowledge and experience during interviews. 365 Data Science has just developed an innovative AI-powered interview preparation tool to help with just that. It offers real-time practice and customizability so you can walk into your next data science or AI interview well-prepared and self-assured.
The #365DataLearningChallenge
To add an element of excitement, 365 Data Science is running a learning challenge alongside the free access period. Participants can earn points by completing courses, projects, and exercises. The top performers can win lifetime platform access, career consultations, and portfolio feedback. So don’t miss this opportunity!
Take Advantage Before November 21
Mark your calendars! This free access window runs from November 1 to November 21, 2024.
Staying competitive is essential in today’s rapidly evolving data and artificial intelligence landscape. This three-week complimentary access to 365 Data Science presents a valuable investment opportunity for your professional growth.
Seize this moment to elevate your career and immerse yourself in data science and AI with 365 Data Science this November.
Begin your journey for free at 365 Data Science.