On December 3rd, 2024, a
post
about the release of {SLmetrics}
was published. Today, January 11th, 2025, version 0.3-1 has been
released and comes with many new features. Among these are weighted
classification and regression metrics, OpenMP
support and a wide array of new evaluation metrics.
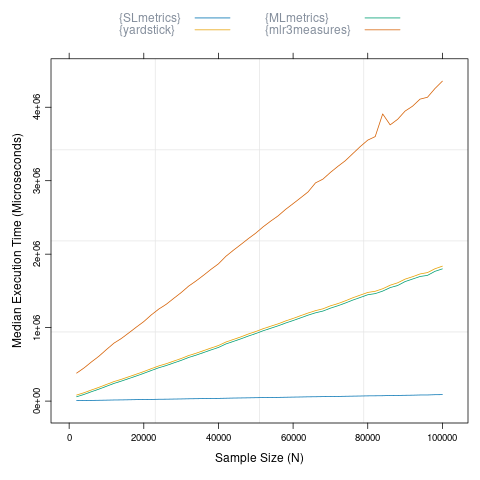
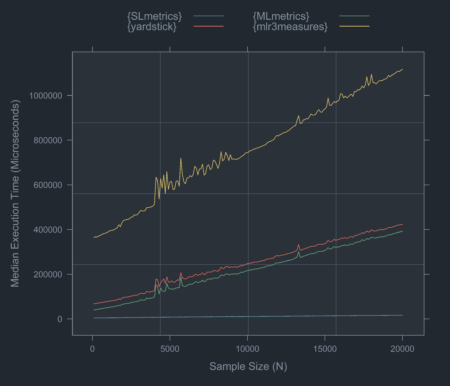
In this blog post, I will benchmark
{SLmetrics} and demostrate how
it compares to the similar R packages
{MLmetrics} and
{yardstick} in terms
execution time and memory efficiency – essential determinants for
scalability and efficiency.
Benchmark Function
To run the benchmark of
{SLmetrics},
{MLmetrics} and
{yardstick}, I will use
{bench} which measures the median
execution time and memory efficiency. Below I have created a wrapper
function:
## benchmark function
benchmark <- function(
  ...,
  m = 10) {
  library(magrittr)
  # 1) create list
  # for storing values
  performance <- list()

  for (i in 1:m) {

     # 1) run the benchmarks
    results <- bench::mark(
      ...,
      iterations = 10,
      check = FALSE
    )

    # 2) extract values
    # and calculate medians
    performance$time[[i]]  <- setNames(
        lapply(results$time, mean),
        results$expression
        )

    performance$memory[[i]] <- setNames(
        lapply(results$memory, function(x) {
             sum(x$bytes, na.rm = TRUE)}
             ), results$expression)

    performance$n_gc[[i]] <- setNames(
        lapply(results$n_gc, sum), results$expression
        )

  }

  purrr::pmap_dfr(
  list(performance$time, performance$memory, performance$n_gc),
  ~{
    tibble::tibble(
      expression = names(..1),
      time = unlist(..1),
      memory = unlist(..2),
      n_gc = unlist(..3)
    )
  }
) %>%
  dplyr::mutate(expression = factor(expression, levels = unique(expression))) %>%
  dplyr::group_by(expression) %>%
  dplyr::filter(dplyr::row_number() > 1) %>%
  dplyr::summarize(
    execution_time = bench::as_bench_time(median(time)),
    memory_usage = bench::as_bench_bytes(median(memory)),
    gc_calls = median(n_gc),
    .groups = "drop"
  )

}
The wrapper function runs 10 x 10 benchmarks of each passed function –
it discards the first run to allow the functions to warm up, before the
benchmarks are recorded.
All values are averaged across runs and then presented as the median
runtime, median memory usage and median number of gc()-calls during
the benchmark.
Benchmarking {SLmetrics}
Bechmarking with and without OpenMP
In the first set of benchmarks, I will demonstrate the new OpenMP
feature that has been shipped with version 0.3-1. For the benchmark,
we will compare the execution time and memory efficiency of computing a
3×3 confusion matrix on two vectors of length 10,000,000 with and
without OpenMP. The source code and results are shown below:
## 1) set seed
set.seed(1903)

## 2) define values
## for classes
actual <- factor(sample(letters[1:3], 1e7, TRUE))
predicted <- factor(sample(letters[1:3], 1e7, TRUE))

## 3) benchmark with OpenMP
SLmetrics::setUseOpenMP(TRUE)
#> OpenMP usage set to: enabled

benchmark(`{With OpenMP}` = SLmetrics::cmatrix(actual, predicted))
#> # A tibble: 1 × 4
#>   expression    execution_time memory_usage gc_calls
#>   <fct>               <bch:tm>    <bch:byt>    <dbl>
#> 1 {With OpenMP}            1ms           0B        0

## 4) benchmark without OpenMP
SLmetrics::setUseOpenMP(FALSE)
#> OpenMP usage set to: disabled

benchmark(`{Without OpenMP}`  = SLmetrics::cmatrix(actual, predicted))
#> # A tibble: 1 × 4
#>   expression       execution_time memory_usage gc_calls
#>   <fct>                  <bch:tm>    <bch:byt>    <dbl>
#> 1 {Without OpenMP}         6.27ms           0B        0
The confusion matrix is computed in less than a millisecond and around
six milliseconds with and without OpenMP, respectively. In both cases,
it uses zero or near-zero memory.
Benchmarking against {MLmetrics} and {yardstick}
In the second set of benchmarks, I will compare the execution time and
memory efficiency of {SLmetrics}
against {MLmetrics} and
{yardstick}. The source code
and results are shown below:
## 1) define classes
set.seed(1903)
fct_actual    <- factor(sample(letters[1:3], size = 1e7, replace = TRUE))
fct_predicted <- factor(sample(letters[1:3], size = 1e7, replace = TRUE))

## 2) perform benchmark
benchmark(
    `{SLmetrics}` = SLmetrics::cmatrix(fct_actual, fct_predicted),
    `{MLmetrics}` = MLmetrics::ConfusionMatrix(fct_predicted, fct_actual),
    `{yardstick}` = yardstick::conf_mat(table(fct_actual, fct_predicted))
)
#> # A tibble: 3 × 4
#>   expression  execution_time memory_usage gc_calls
#>   <fct>             <bch:tm>    <bch:byt>    <dbl>
#> 1 {SLmetrics}         6.34ms           0B        0
#> 2 {MLmetrics}       344.13ms        381MB       19
#> 3 {yardstick}       343.75ms        381MB       19
{SLmetrics} is roughly 60 times
faster than both, and significantly more memory efficient as
demonstrated by memory_usage and gc_calls. In this perspective,
{SLmetrics} is more efficient
and scalable than both packages as the memory usage is basically linear.
See below:
## 1) define classes
set.seed(1903)
fct_actual    <- factor(sample(letters[1:3], size = 2e7, replace = TRUE))
fct_predicted <- factor(sample(letters[1:3], size = 2e7, replace = TRUE))

## 2) perform benchmark
benchmark(
    `{SLmetrics}` = SLmetrics::cmatrix(fct_actual, fct_predicted),
    `{MLmetrics}` = MLmetrics::ConfusionMatrix(fct_predicted, fct_actual),
    `{yardstick}` = yardstick::conf_mat(table(fct_actual, fct_predicted))
)
#> # A tibble: 3 × 4
#>   expression  execution_time memory_usage gc_calls
#>   <fct>             <bch:tm>    <bch:byt>    <dbl>
#> 1 {SLmetrics}         12.3ms           0B        0
#> 2 {MLmetrics}        648.5ms        763MB       19
#> 3 {yardstick}        654.7ms        763MB       19
{SLmetrics} can process 60x the
data in the same time it takes
{MLmetrics} and
{yardstick} to process
40,000,000 data-points – without any additional memory cost.
Summary
The benchmarks suggests that
{SLmetrics} is a strong
contender to the more established packages
{MLmetrics} and
{yardstick} in terms of
scalability, memory efficiency and speed.
Installing {SLmetrics}
{SLmetrics} is still under
development and is therefore not on CRAN. But the latest release can be
installed using {devtools}. A
development version is also available for those living on the edge. See
below:
Stable version
## install stable release
devtools::install_github(
  repo = 'https://github.com/serkor1/SLmetrics@*release',
  ref  = 'main'
)
Development version
## install development version
devtools::install_github(
  repo = 'https://github.com/serkor1/SLmetrics',
  ref  = 'development'
)
If you made it this far: Thank you for reading the blog post, and feel
free to leave a comment here or in the repository.