We are excited to announce the release of the plotmm R package (v0.1.0), which is a suite of tidy tools for visualizing mixture model output. plotmm is a substantially updated version of the plotGMM package (Waggoner and Chan). Whereas plotGMM only includes support for visualizing univariate Gaussian mixture models fit via the mixtools package, the new plotmm package supports numerous mixture model specifications from several packages (model objects).
plot_mm(): The main function of the package, plot_mm() allows the user to simply input the name of the fit mixture model, as well as an optional argument to pass the number of components k that were used in the original fit. Note: the function will automatically detect the number of components if k is not supplied. The result is a tidy ggplot of the density of the data with overlaid mixture weight component curves. Importantly, as the grammar of graphics is the basis of visualization in this package, all other tidy-friendly customization options work with any of the plotmm’s functions (e.g., customizing with ggplot2’s functions like labs() or theme_*(); or patchwork’s plot_annotation()).
plot_cut_point(): Mixture models are often used to derive cut points of separation between groups in feature space. plot_cut_point() plots the data density with the overlaid cut point (point of greatest separation between component class means) from the fit mixture model.
plot_mix_comps(): A helper function allowing for expanded customization of mixture model plots. The function superimposes the shape of the components over a ggplot2 object. plot_mix_comps() is used to render all plots in the main plot_mm() function, and is not bound by package-specific objects, allowing for greater flexibility in plotting models not currently supported by the main plot_mm() function.
plot_gmm(): The original function upon which the package was expanded. It is included in plotmm for quicker access to a common mixture model form (univariate Gaussian), as well as to bridge between the original plotGMM package.
plot_mix_comps_normal(): Similarly, this function is the original basis of plot_mix_comps(), but for Gaussian mixture models only. It is included in plotmm for bridging between the original plotGMM package.
Note that though plotmm includes many updates and expanded functionality beyond plotGMM, it is under active development with support for more model objects and specifications forthcoming. Stay tuned for updates, and always feel free to open an issue ticket to share anything you’d like to see included in future versions of the package. Thanks and enjoy!
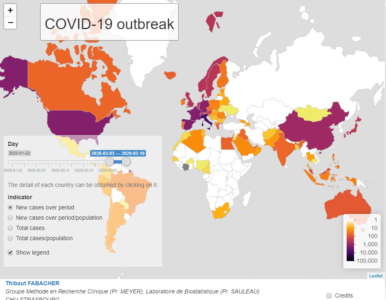
The departement of Public Health of the Strasbourg University Hospital (GMRC, Prof. Meyer) and the Laboratory of Biostatistics and Medical Informatics of the Strasbourg Medicine Faculty (Prof. Sauleau), to the extent of their means and expertise, are contributing to the fight against Covid-19 infection. Doctor Fabacher has produced an interactive map for global monitoring of the infection, accessible at :
This map, which complements the Johns Hopkins University tool (Coronavirus COVID-19 Global Cases by Johns Hopkins CSSE), focuses on the evolution of the number of cases per country and for a given period, but in terms of incidence and prevalence. It is updated daily.
The period of interest can be defined by the user and it is possible to choose :
The count of new cases over a period of time or the same count in relation to the population of the country (incidence).
The total case count over a period of time or the same count reported to the population (prevalence).
This map is made using R with shiny, leaflet and dplyr packages.
Reference Dong E, Du H, Gardner L. An interactive web-based dashboard to track COVID-19 in real time. Lancet Infect Dis; published online Feb 19. https://doi.org/10.1016/S1473-3099(20)30120-1.
Note that GTK+ library is not already installed on your system, installation may fail. In that case, please install and load the gWidgetsRGtk2 library beforehand:
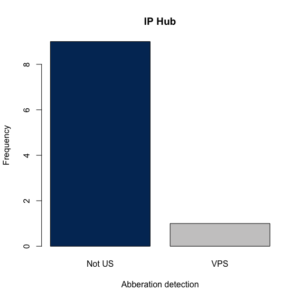
We are excited to announce the latest major release of rIP (v1.2.0), which is an R package that detects fraud in online surveys by tracing, scoring, and visualizing IP addresses. Essentially, rIP takes an array of IP addresses, which are always captured in online surveys (e.g., MTurk), and the keys for the services the user wishes to use (IP Hub, IP Intel, and Proxycheck), and passes these to all respective APIs. The output is a dataframe with the IP addresses, country, internet service provider (ISP), labels for non-US IP Addresses, whether a virtual private server (VPS) was used, and then recommendations for blocking the IP address. Users also have the option to visualize the distributions, as discussed below in the updates to v1.2.0.
Especially important in this is the variable “block”, which gives a score indicating whether the IP address is likely from a “server farm” and should be excluded from the data. It is coded 0 if the IP is residential/unclassified (i.e. safe IP), 1 if the IP is non-residential IP (hostping provider, proxy, etc. – should likely be excluded, though the decision to do so is left to the researcher), and 2 for non-residential and residential IPs (more stringent, may flag innocent respondents).
Including some great contributions from Bob Rudis, some of the key feature updates included in v1.2.0 of rIP are:
Added discrete API endpoints for the three IP services so users can use this as a general purpose utility package as well as for the task-specific functionality currently provided. Each endpoint is tied to an environment variable for the secret info (API key or contact info). This is documented in each function.
On-load computed package global .RIP_UA which is an httr user_agent object, given the best practice to use an identifiable user agent when making API calls so the service provider can track usage and also follow up with any issues they see.
A new plotting option that, when set to “TRUE”, produces a barplot of the IP addresses checked with color generated via the amerika package.
Users can now supply any number of IP service keys they wish to use (1, 2, or all 3), and the function will ping only the preferred IP check services (formerly, the package required all three keys or none to be entered).
For those interested in reading more and citing the package in published work, check out our recently published software paper in the Journal of Open Source Software.
Here is a quick demo of the package with some fake (auto-generated) IP addresses:
# Install and load rIP, v1.2.0
install.packages("rIP")
library(rIP)

# Store personal keys (only "IP Hub" used here)
ip_hub_key = "MzI2MTpkOVpld3pZTVg1VmdTV3ZPenpzMmhodkJmdEpIMkRMZQ=="

ipsample = data.frame(rbind(c(1, "15.79.157.16"), c(2, "1.223.176.227"), c(3, "72.167.36.25"), c(4, "5.195.165.176"),
                             c(5, "27.28.25.206"), c(6, "106.118.241.121"), c(7, "231.86.14.33"), c(8, "42.56.9.80"), c(9, "41.42.62.229"),
                             c(10, "183.124.243.176")))
names(ipsample) = c("number", "IPAddress")

# Call the getIPinfo function to check the IPs
getIPinfo(ipsample, "IPAddress", iphub_key = ip_hub_key, plots = TRUE)
Running the code above will generate the following plot, as well as the dataframe mentioned above.
Note that to use the package, users must have valid personal keys for any IP service they wish to call via the function. These can be obtained for free at the corresponding IP check services.
Finally, we welcome contributions and reports of bugs either by opening an issue ticket or a pull request at the corresponding Github repository. Thanks and enjoy the package!
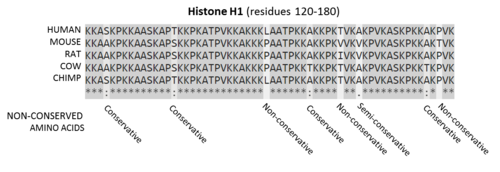
Proteins are conserved bio molecules present in all organisms. Some proteins are conserved in many similar species, making them homologues of each other, meaning that the sequence is not the same but there is a degree of similarity.
R is a high level programming language with a focus on statistical analysis and machine learning.R Project
R is widely used in bioinformatics and has a huge resources library of packages, most of them developed by the top Universities to help with hard to understand data, like genomic and proteomic data.
Why this matters?
This matters because antibodies will bind to specific proteins, but many proteins have similar structure and sequence. So when performing an assay you want to know what specific protein the antibody binds to.
This is also relevant when choosing an antibody that works in many species, specially when doing research in less used species, like veterinary studies.
Getting Started
You need the sequence of the epitope used to produce the antibody, I need to know where this product will bind in the target protein. If the sequence is very conserved in mammalians for example, this will be homologue in other species; eg. actins, membrane proteins, etc.
Obtaining the data
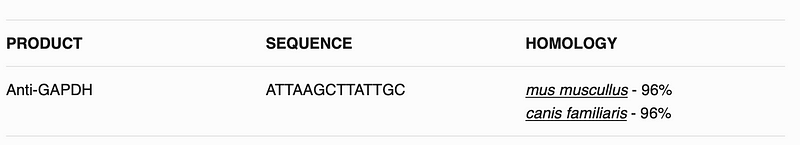
Data for sequence can be provided by the manufacturer, in some cases it will be in the terms of region of the protein, eg. 162–199aa in C-terminal of RAB22A human.
In these cases I will need to retrieve the protein sequence fromUNIPROTand then cut it according to the information I have on the immunogen, this can be done using a program sequentially, like Rstringipackage or using an excel sheet withMIDfunction.
For this case the sequence is in a column calledsequenceImunogenthat is why I have to make a loop so the protein blast goes through all the sequences in the data frame.
The function
I will use the functionblastSequencesto blast the protein and obtain the homology of this specific sequence to other species. The parameters of the function can be found in theliterature. I usedprogram = “blastp”so I perform aProtein Blast, I use a hitListSize of 50 and a timeout of 200 seconds, this is from previous experience, as I will do this for multiple sequences I prefer the data to beas = data.frame.
x <- blastSequences(x = Sequence, timeout = 200, as = "data.frame", program = "blastp", hitListSize = 50)
Making a loop in R
When creating a loop in R I always put aStartvariable with theSys.time()constant, so I know how long it takes to run this loop.
Start <- Sys.time()
I have use this in a couple of hundred sequences and the result toke a few days, so keep that in mind when you run.
I first create a function that formats my results in terms of percentage of homology and give it the term percentage.
#Create a percent function
percent <- function(x, digits = 1, format = "f", ...) {
paste0(formatC(100 * x, format = format, digits = digits, ...), "%")
           }
Cleaning the result data
Once the blastP results come, the 1st step is to clean unwanted information so it is not confusing, I used the base functionssubset,grepl,gsubto get only information with results verified, and remove annoying characters. The objective is to have a nice table result with the best homologues.
#Remove what I do not want
x <- subset(x, grepl("_A", x$Hit_accession) == FALSE)
x <- subset(x, grepl("XP_", x$Hit_accession) == FALSE)
x <- subset(x, grepl("unnamed", x$Hit_def) == FALSE)

#Removing characters that do not
x$Species <- sub(".*\\[(.*)\\].*", "\\1", x$Hit_def, perl=TRUE)
x$Species <- gsub("/].*","", x$Species)
x$Hit_def <- gsub("[[:punct:]].*", "", x$Hit_def)
Retrieving the results above 80% identical
After I get all the results and clean a bit of the results, I want to subset the homologues to above 80%. To do this I count the total characters of the sequence usingncharfunction and divide the total number of hit results by this number of character, ie. for a 100 aa sequence if I hit 80 I get a 80% homology.
I Remove also any duplicated information from our table, and paste all the result into a new column, with all results separated by (line break in HTML), to do this I use the functionpaste, with the optioncollapse = “<br>”
This will create hopefully a table like following:
All the code
All the code can be seen bellow: UseTryCatchfor error management, sometimes the functions times out and you need to rerun, you get a prompt asking to skip or run again, a simple Y is enough.
Start <- Sys.time()
for (i in 1:nrow(dataframe)) {
tryCatch({
percent <- function(x, digits = 1, format = "f", ...) { paste0(formatC(100 * x, format = format, digits = digits, ...), "%")
}
x <- blastSequences(x = dataframe$sequenceImunogen[i], timeout = 200, as = "data.frame", program = "blastp", hitListSize = 50)
#Remove what I do not want
x <- subset(x, grepl("_A", x$Hit_accession) == FALSE)
x <- subset(x, grepl("XP_", x$Hit_accession) == FALSE)
x <- subset(x, grepl("unnamed", x$Hit_def) == FALSE)
#Removing characters that do not
x$Species <- sub(".\\[(.)\\].*", "\\1", x$Hit_def, perl=TRUE)
x$Species <- gsub("/].*","", x$Species)
x$Hit_def <- gsub("[[:punct:]].*", "", x$Hit_def)
x$Hsp_identity <- as.numeric(x$Hsp_identity)
n <- nchar(masterir2$sequenceImunogen[i])
x$percentage <- as.numeric(x$Hsp_identity/n)
x<- x[order(-x$percentage), ]
x<- x[x$percentage > 0.8, ]
x$percentage <- percent(x$percentage)
x$link <- paste0("https://www.ncbi.nlm.nih.gov/protein/",x$Hit_accession)
    x$final <- paste(x$Hit_def, x$Species, x$percentage, sep = " - ")
    x <- subset(x,!duplicated(x$final))
    x$TOTAL <- paste0("<a href='",x$link,"'target='_blank'>",x$final,"</a>")
dataframe$Homology[i] <- paste(unlist(x$TOTAL), collapse ="</br>")
}, error=function(e{cat("ERROR :",conditionMessage(e), "\n")})
}
end <- Sys.time()
print(end - Start)
Conclusion
I can use R and the Bioinformatics packages in Bioconductor to retrieve the homology of known epitopes, this help us provide more valuable information to researchers.
Homology is important in the niche world of antibodies, there is a limited amount of money for validation and a limited amount of species that the antibodies can be tested on. With this simple program a homology can be check in a click of a button, instead of using
What next?
This can be incorporated into a small web application that can provide the homology for a specific selected product with a click off a button, saving time to search and blast on the NCBI website.
I am very new to the world of R and coding, so any comment is appreciated.