What is homology?
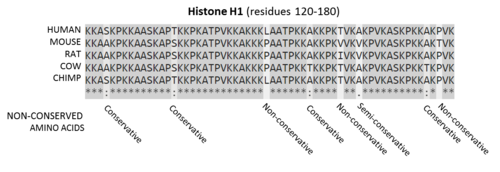
Proteins are conserved bio molecules present in all organisms. Some proteins are conserved in many similar species, making them homologues of each other, meaning that the sequence is not the same but there is a degree of similarity.
This is measured as homology in percentage.
What is R
R is a high level programming language with a focus on statistical analysis and machine learning. R Project
R is widely used in bioinformatics and has a huge resources library of packages, most of them developed by the top Universities to help with hard to understand data, like genomic and proteomic data.
Why this matters?
This matters because antibodies will bind to specific proteins, but many proteins have similar structure and sequence. So when performing an assay you want to know what specific protein the antibody binds to.
This is also relevant when choosing an antibody that works in many species, specially when doing research in less used species, like veterinary studies.
Getting Started
You need the sequence of the epitope used to produce the antibody, I need to know where this product will bind in the target protein. If the sequence is very conserved in mammalians for example, this will be homologue in other species; eg. actins, membrane proteins, etc.
Obtaining the data
Data for sequence can be provided by the manufacturer, in some cases it will be in the terms of region of the protein, eg. 162–199aa in C-terminal of RAB22A human.
In these cases I will need to retrieve the protein sequence from UNIPROT and then cut it according to the information I have on the immunogen, this can be done using a program sequentially, like R stringi package or using an excel sheet with MID function.
Prepare environment in R (libraries)
I will use Bioconductor packages:#Install packages: rBLAST, Biostrings, annotate
install.packages("devtools")
library(devtools)
install_github("mhahsler/rBLAST")
source("https://bioconductor.org/biocLite.R")
biocLite("Biostrings")
biocLite("annotate")
These libraries will help us retrieve the homology data, and then I will use simple commands to clean and present the data in a nice way.
Cleaning data
Cleaning the data is usually 80% of the work of any data scientist.
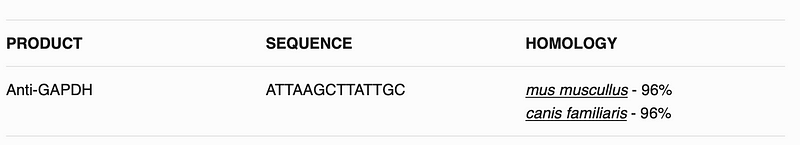
I want the homology in simple terms of aa, or in bioinformatic terms FASTA; eg.
ATTAAGCTTATTGC
You can have terminal places, that need to be removed, usually in terms of ‘-C’, I can remove this using a simple gsub function.
dataframe$sequenceImunogen <- gsub("\\-C", "", dataframe$sequenceImunogen)
For this case the sequence is in a column called sequenceImunogen that is why I have to make a loop so the protein blast goes through all the sequences in the data frame.
The function
I will use the function blastSequences to blast the protein and obtain the homology of this specific sequence to other species. The parameters of the function can be found in the literature. I used program = “blastp” so I perform a Protein Blast, I use a hitListSize of 50 and a timeout of 200 seconds, this is from previous experience, as I will do this for multiple sequences I prefer the data to be as = data.frame.
x <- blastSequences(x = Sequence, timeout = 200, as = "data.frame", program = "blastp", hitListSize = 50)
Making a loop in R
When creating a loop in R I always put a Start variable with the Sys.time()constant, so I know how long it takes to run this loop.
Start <- Sys.time()
I have use this in a couple of hundred sequences and the result toke a few days, so keep that in mind when you run.
I first create a function that formats my results in terms of percentage of homology and give it the term percentage.
#Create a percent function
percent <- function(x, digits = 1, format = "f", ...) {
paste0(formatC(100 * x, format = format, digits = digits, ...), "%")
           }
Cleaning the result data
Once the blastP results come, the 1st step is to clean unwanted information so it is not confusing, I used the base functions subset, grepl, gsub to get only information with results verified, and remove annoying characters. The objective is to have a nice table result with the best homologues.
#Remove what I do not want
x <- subset(x, grepl("_A", x$Hit_accession) == FALSE)
x <- subset(x, grepl("XP_", x$Hit_accession) == FALSE)
x <- subset(x, grepl("unnamed", x$Hit_def) == FALSE)

#Removing characters that do not
x$Species <- sub(".*\\[(.*)\\].*", "\\1", x$Hit_def, perl=TRUE)
x$Species <- gsub("/].*","", x$Species)
x$Hit_def <- gsub("[[:punct:]].*", "", x$Hit_def)
Retrieving the results above 80% identical
After I get all the results and clean a bit of the results, I want to subset the homologues to above 80%. To do this I count the total characters of the sequence using nchar function and divide the total number of hit results by this number of character, ie. for a 100 aa sequence if I hit 80 I get a 80% homology.
x$Hsp_identity <- as.numeric(x$Hsp_identity)
n <- nchar(dataframe$sequenceImunogen[i])
x$percentage <- as.numeric(x$Hsp_identity/n)
x<- x[order(-x$percentage), ]
x<- x[x$percentage > 0.8, ]
x$percentage <- percent(x$percentage)
I then clean the result to show as percentage.
Format nice output
I want this to be able to be presented in HTML, so I use HTML tags to create a visually pleasing table.
Because this is to be online I want to add hyperlinks to the results so my customers can see the result and analyse the data.
x$link <- paste0("https://www.ncbi.nlm.nih.gov/protein/",x$Hit_accession)
    x$final <- paste(x$Hit_def, x$Species, x$percentage, sep = " - ")
    x <- subset(x,!duplicated(x$final))
    x$TOTAL <- paste0("<a href='",x$link,"'target='_blank'>",x$final,"</a>")
I Remove also any duplicated information from our table, and paste all the result into a new column, with all results separated by
(line break in HTML), to do this I use the function paste, with the option collapse = “<br>”
This will create hopefully a table like following:
All the code
All the code can be seen bellow: Use TryCatch for error management, sometimes the functions times out and you need to rerun, you get a prompt asking to skip or run again, a simple Y is enough.
Start <- Sys.time()
    for (i in 1:nrow(dataframe)) {
          tryCatch({
          percent <- function(x, digits = 1, format = "f", ...) { paste0(formatC(100 * x, format = format, digits = digits, ...), "%")
                    }
            x <- blastSequences(x = dataframe$sequenceImunogen[i], timeout = 200, as = "data.frame", program = "blastp", hitListSize = 50)

#Remove what I do not want
      x <- subset(x, grepl("_A", x$Hit_accession) == FALSE)
      x <- subset(x, grepl("XP_", x$Hit_accession) == FALSE)
      x <- subset(x, grepl("unnamed", x$Hit_def) == FALSE)

#Removing characters that do not
      x$Species <- sub(".\\[(.)\\].*", "\\1", x$Hit_def, perl=TRUE)
      x$Species <- gsub("/].*","", x$Species)
      x$Hit_def <- gsub("[[:punct:]].*", "", x$Hit_def)
      x$Hsp_identity <- as.numeric(x$Hsp_identity)
      n <- nchar(masterir2$sequenceImunogen[i])
      x$percentage <- as.numeric(x$Hsp_identity/n)
      x<- x[order(-x$percentage), ]
      x<- x[x$percentage > 0.8, ]
      x$percentage <- percent(x$percentage)

      x$link <- paste0("https://www.ncbi.nlm.nih.gov/protein/",x$Hit_accession)
      x$final <- paste(x$Hit_def, x$Species, x$percentage, sep = " - ")
      x <- subset(x,!duplicated(x$final))
      x$TOTAL <- paste0("<a href='",x$link,"'target='_blank'>",x$final,"</a>")

  dataframe$Homology[i] <- paste(unlist(x$TOTAL), collapse ="</br>")
}, error=function(e{cat("ERROR :",conditionMessage(e), "\n")})
    }
end <- Sys.time()
print(end - Start)
Conclusion
I can use R and the Bioinformatics packages in Bioconductor to retrieve the homology of known epitopes, this help us provide more valuable information to researchers.
Homology is important in the niche world of antibodies, there is a limited amount of money for validation and a limited amount of species that the antibodies can be tested on. With this simple program a homology can be check in a click of a button, instead of using
What next?
This can be incorporated into a small web application that can provide the homology for a specific selected product with a click off a button, saving time to search and blast on the NCBI website.
I am very new to the world of R and coding, so any comment is appreciated.