This R-Guru cheat sheet is ideal for Statistical Programmers since it contains best practice examples for creating and updating tibbles in the pharma industry. Examples show common R tasks for importing data, creating data frames, direct variable referencing, piping, conditional and group processing, sql components, character and date operations, variable type conversions, transposing data frames, joining data frames, appending data frames, deriving summary variables, and creating graphs and output files. When possible, base R sample data frames are used in examples.
Category: R
Get DataCamp Premium for Just $1!
The best learning investment you’ll ever make. For one week only, get unlimited access to DataCamp for one month for just $1. Regular subscription resumes after first month.
Running until October 8, 2023, online data science and AI learning platform DataCamp is offering its premium subscription for only $1. With DataCamp Premium, you gain unlimited access to:
450+ interactive data and AI courses for all levels
Master the world’s most in-demand technologies with no prior experience needed. Start coding from day one with expert-led courses across R, Python, ChatGPT, SQL, Power BI, Generative AI, and more.
Forbes’ #1 ranked data certification program
Prove your data science skills and build a CV that stands out with multiple industry-leading certifications at both associate and professional levels.
Brand new AI curriculum
DataCamp has gathered AI leaders to produce an AI curriculum to meet the rapidly evolving needs of generative AI. From basic prompt engineering to AI literacy, ethics, and more—uncover all the tools you need to maximize your productivity and creativity with AI.
DataCamp Workspace x DataCamp Portfolio
Workspace a modern data science notebook complete with AI assistant. With instant set-up, pre-built templates, and no download required, Workspace gets you to insights, faster.
Easily build a data portfolio in minutes to leverage alongside your resume. With intuitive features, anyone can create a high-quality portfolio— technical design or coding is required.
All this, and much more—offer ends Oct 8
Whatever your discipline, equip yourself with essential data and AI skills to thrive in this next digital era. DataCamp’s interactive learning empowers learners of all levels to acquire new skills at their own pace.
Network Analysis with R workshop
Join our workshop on Network Analysis with R, which is a part of our workshops for Ukraine series!
Here’s some more info:
Title: Network Analysis with R
Date: Thursday, October 26th, 18:00 – 20:00 CEST (Rome, Berlin, Paris timezone)
Speaker: David Schoch is the team lead for “Transparent Social Analytics” in the Department Computational Social Science at GESIS in Cologne. Before joining GESIS, David was a Presidential Fellow in the Department of Sociology at the University of Manchester, affiliated with the “Mitchell Centre for Social Network Analysis”. He has a PhD in Computer Science from the University of Konstanz and is the creator and maintainer of several network analysis R packages.
Description: Network analysis is a multidisciplinary field that delves into the intricate web of connections and interactions among entities, whether they are individuals, organizations, or nodes in a complex system. By employing graph theory, statistical methods, and computational tools, network analysis unveils the hidden patterns, structures, and dynamics that underlie these relationships.
In this workshop, I will introduce the package ecosystem for network analysis in R. I provide an overview of the key packages to conduct network studies and discuss some practical aspects. No network theory will be introduced, but I provide pointers for those who are interested to learn more beyond practical skills.
Minimal registration fee: 20 euro (or 20 USD or 800 UAH)
How can I register?
- Go to https://bit.ly/3wvwMA6 or https://bit.ly/3PFxtNA and donate at least 20 euro. Feel free to donate more if you can, all proceeds go directly to support Ukraine.
- Save your donation receipt (after the donation is processed, there is an option to enter your email address on the website to which the donation receipt is sent)
- Fill in the registration form, attaching a screenshot of a donation receipt (please attach the screenshot of the donation receipt that was emailed to you rather than the page you see after donation).
If you are not personally interested in attending, you can also contribute by sponsoring a participation of a student, who will then be able to participate for free. If you choose to sponsor a student, all proceeds will also go directly to organisations working in Ukraine. You can either sponsor a particular student or you can leave it up to us so that we can allocate the sponsored place to students who have signed up for the waiting list.
How can I sponsor a student?
- Go to https://bit.ly/3wvwMA6 or https://bit.ly/3PFxtNA and donate at least 20 euro (or 17 GBP or 20 USD or 800 UAH). Feel free to donate more if you can, all proceeds go to support Ukraine!
- Save your donation receipt (after the donation is processed, there is an option to enter your email address on the website to which the donation receipt is sent)
- Fill in the sponsorship form, attaching the screenshot of the donation receipt (please attach the screenshot of the donation receipt that was emailed to you rather than the page you see after the donation). You can indicate whether you want to sponsor a particular student or we can allocate this spot ourselves to the students from the waiting list. You can also indicate whether you prefer us to prioritize students from developing countries when assigning place(s) that you sponsored.
If you are a university student and cannot afford the registration fee, you can also sign up for the waiting list here. (Note that you are not guaranteed to participate by signing up for the waiting list).
You can also find more information about this workshop series, a schedule of our future workshops as well as a list of our past workshops which you can get the recordings & materials here.
Looking forward to seeing you during the workshop!
Introduction to Topic Modelling in R and Python workshop
Join our workshop on Introduction to Topic Modelling in R and Python, which is a part of our workshops for Ukraine series!
Here’s some more info:
Title: Introduction to Topic Modelling in R and Python
Date: Thursday, October 19th, 18:00 – 20:00 CEST (Rome, Berlin, Paris timezone)
Speaker: Christian Czymara is a postdoc fellow at Tel Aviv University. His research focuses on attitudes, immigration, and political communication using quantitative and computational methods as well as natural language processing.
Description: This workshop offers an in-depth exploration of topic models, which allow extracting meaningful insights from extensive text corpora while minimizing the reliance on prior assumptions or annotated data. The workshop will start with the basics of text data preprocessing and progress to a general understanding of the underlying principles of topic modeling. It will cover a range of topic modeling techniques, such as Structural Topic Models, BiTerm, and Keyword Assisted Topic Models in R, and BERTopic in Python. We will explore the cases where each model is particularly promising. Participants will learn about the practical considerations when choosing a topic modeling algorithm, and how to apply these techniques to their own data. The lecture will be of interest to researchers and practitioners who are interested in extracting insights from large volumes of textual data, such as social media, news articles, or scientific publications.
Minimal registration fee: 20 euro (or 20 USD or 800 UAH)
How can I register?
- Go to https://bit.ly/3wvwMA6 or https://bit.ly/3PFxtNA and donate at least 20 euro. Feel free to donate more if you can, all proceeds go directly to support Ukraine.
- Save your donation receipt (after the donation is processed, there is an option to enter your email address on the website to which the donation receipt is sent)
- Fill in the registration form, attaching a screenshot of a donation receipt (please attach the screenshot of the donation receipt that was emailed to you rather than the page you see after donation).
If you are not personally interested in attending, you can also contribute by sponsoring a participation of a student, who will then be able to participate for free. If you choose to sponsor a student, all proceeds will also go directly to organisations working in Ukraine. You can either sponsor a particular student or you can leave it up to us so that we can allocate the sponsored place to students who have signed up for the waiting list.
How can I sponsor a student?
- Go to https://bit.ly/3wvwMA6 or https://bit.ly/3PFxtNA and donate at least 20 euro (or 17 GBP or 20 USD or 800 UAH). Feel free to donate more if you can, all proceeds go to support Ukraine!
- Save your donation receipt (after the donation is processed, there is an option to enter your email address on the website to which the donation receipt is sent)
- Fill in the sponsorship form, attaching the screenshot of the donation receipt (please attach the screenshot of the donation receipt that was emailed to you rather than the page you see after the donation). You can indicate whether you want to sponsor a particular student or we can allocate this spot ourselves to the students from the waiting list. You can also indicate whether you prefer us to prioritize students from developing countries when assigning place(s) that you sponsored.
If you are a university student and cannot afford the registration fee, you can also sign up for the waiting list here. (Note that you are not guaranteed to participate by signing up for the waiting list).
You can also find more information about this workshop series, a schedule of our future workshops as well as a list of our past workshops which you can get the recordings & materials here.
Looking forward to seeing you during the workshop!
Introduction to Qualitative Comparative Analysis (QCA)
Join our workshop on Introduction to Qualitative Comparative Analysis (QCA) using R, which is a part of our workshops for Ukraine series!
Here’s some more info:
Title: Introduction to Qualitative Comparative Analysis (QCA) using R
Date: Thursday, October 5th, 18:00 – 20:00 CEST (Rome, Berlin, Paris timezone)
Speaker: Ingo Rohlfing, Ingo Rohlfing is Professor of Methods of Empirical Social Research at the University of Passau. He is doing research on social science methods with a focus on qualitative methods (case studies and process tracing), Qualitative Comparative Analysis, multimethod research and research integrity.
Description: What are the conditions that produce stable coalition governments? What conditions are necessary for married couples not getting divorced? If you are interested in research questions like these or similar ones, QCA should be one of the first methods to consider for answering them. QCA is the go-to method for analyzing set relationships using any number of cases (small, medium, large) and with any kind of data (micro, meso, macro).
The participants of this course are introduced to the fundamentals of set relations and QCA, and the workflow of a QCA study using R. You are be introduced to the basic principles and requirements of coherent QCA designs and learn how to implement them using R. We cover all fundamental steps of a QCA study, including calibration; a necessity analysis (potentially); truth table formation; truth table minimization and interpretation of results.
Minimal registration fee: 20 euro (or 20 USD or 800 UAH)
How can I register?
- Go to https://bit.ly/3wvwMA6 or https://bit.ly/3PFxtNA and donate at least 20 euro. Feel free to donate more if you can, all proceeds go directly to support Ukraine.
- Save your donation receipt (after the donation is processed, there is an option to enter your email address on the website to which the donation receipt is sent)
- Fill in the registration form, attaching a screenshot of a donation receipt (please attach the screenshot of the donation receipt that was emailed to you rather than the page you see after donation).
If you are not personally interested in attending, you can also contribute by sponsoring a participation of a student, who will then be able to participate for free. If you choose to sponsor a student, all proceeds will also go directly to organisations working in Ukraine. You can either sponsor a particular student or you can leave it up to us so that we can allocate the sponsored place to students who have signed up for the waiting list.
How can I sponsor a student?
- Go to https://bit.ly/3wvwMA6 or https://bit.ly/3PFxtNA and donate at least 20 euro (or 17 GBP or 20 USD or 800 UAH). Feel free to donate more if you can, all proceeds go to support Ukraine!
- Save your donation receipt (after the donation is processed, there is an option to enter your email address on the website to which the donation receipt is sent)
- Fill in the sponsorship form, attaching the screenshot of the donation receipt (please attach the screenshot of the donation receipt that was emailed to you rather than the page you see after the donation). You can indicate whether you want to sponsor a particular student or we can allocate this spot ourselves to the students from the waiting list. You can also indicate whether you prefer us to prioritize students from developing countries when assigning place(s) that you sponsored.
If you are a university student and cannot afford the registration fee, you can also sign up for the waiting list here. (Note that you are not guaranteed to participate by signing up for the waiting list).
You can also find more information about this workshop series, a schedule of our future workshops as well as a list of our past workshops which you can get the recordings & materials here.
Looking forward to seeing you during the workshop!
Access DataCamp’s entire platform for free until September 3, 11.59 PM EST!
Access DataCamp’s entire platform for free until September 3, 11.59 PM EST!
This one-time deal covers all 440+ data and AI courses. No catch, no credit card required—just unlimited learning for anyone with internet access.
What is Free Access Week?
Free week is exactly that, a free week to explore all of DataCamp’s features for zero cost.
Until September 3, 11.59 PM EST anyone can access DataCamp Premium features with a free DataCamp account. All courses, products, and features are available in the browser, so you don’t need any additional software to access DataCamp.
Don’t have an account? Sign up here and start using DataCamp immediately.
There has never been a better time to start learning data and AI
The proliferation of Generative AI has sharpened the need for data and AI skills in the modern world.
Whether you’re looking to learn or develop your R programming skills, take your first steps with ChatGPT, or you’re a business leader looking to upskill your team to improve data-driven decision-making—Free Access Week is available to everyone.
What can you access during Free Week?
Everything. Here’s an overview of what you get as part of Free Access Week:
- 440+ interactive data and AI courses; including Introductions to R, ChatGPT, Python, SQL, and more. Alongside, advanced courses in MLOps, deep learning, image processing, and much more.
- Challenge yourself with skill and career tracks; including the highly popular, full-circle R Programming skills track, start from zero and work your way through tailored learning paths to master some of the world’s most in-demand technologies.
- Access 100+ real-life projects, 20+ assessments to benchmark your skills, and more—all designed to help you learn new skills quickly.
- Prove yourself with Forbes’ #1 ranked data certification program. Available at Associate and Professional levels, verify your skills as a Data Scientist or Data Analyst (Associate or Professional), or Data Engineer (Associate).
Unlimited world-class education
Gain unlimited access to DataCamp’s entire learning library.
Brand-new AI curriculum
Go from zero to leveraging AI in your workflows in just a few hours of learning.
At DataCamp, our mission is to democratize data and AI skills for everyone. In collaboration with experts from Google, Microsoft, and Duolingo, they’ve developed an AI curriculum to empower more learners to harness the power of AI in their daily lives.
Whether you invest in the 10-hour AI Fundamentals Track or jump into individual courses such as Introduction to ChatGPT, Generative AI Concept, or Understanding Machine Learning, DataCamp’s interactive learning and bite-sized exercises make mastering new skills a breeze.
Dive into data science learning for all levels
DataCamp is for everyone: whether you have no prior data skills or you’re proficient in multiple programming languages.
If you’re looking for a starting point, check out our interactive course list below to give you a glimpse into our comprehensive course library:
Beginners courses:
- Introduction to Data
- Introduction to Power BI
- Introduction to Tableau
- Introduction to Python
- Introduction to R
- Introduction to Excel
- Introduction to SQL
- Data Visualization for Everyone
- Data Science for Everyone
- Introduction to Relational Databases in SQL
Intermediate courses
- Introduction to Data Warehousing
- Introduction to Docker
- Creating Dashboards with shinydashboard
- Python Data Science Toolbox (Part 1 and 2)
- Data Modeling in Power BI
- Writing Efficient R Code
Advanced courses
- Intermediate Data Modeling
- Image Processing in Python
- Data-Driven Decision-Making in SQL
- Ensemble Methods in Python
- Introduction to Bash Scripting
- Introduction to Scala
- Introduction to Airflow with Python
Projects to test your skills in real-world scenarios:
Beginner:
Intermediate:
Advanced:
- Naïve Bees: Image Loading and Processing
- Naïve Bees: Deep Learning with Images
- Naïve Bees: Predict Species with Images
Take advantage of this one-time deal to test your skills on a world-class learning platform before the window shuts!
Build serverless shiny application via Github page
Simple guide for simple shiny application
TL;DR
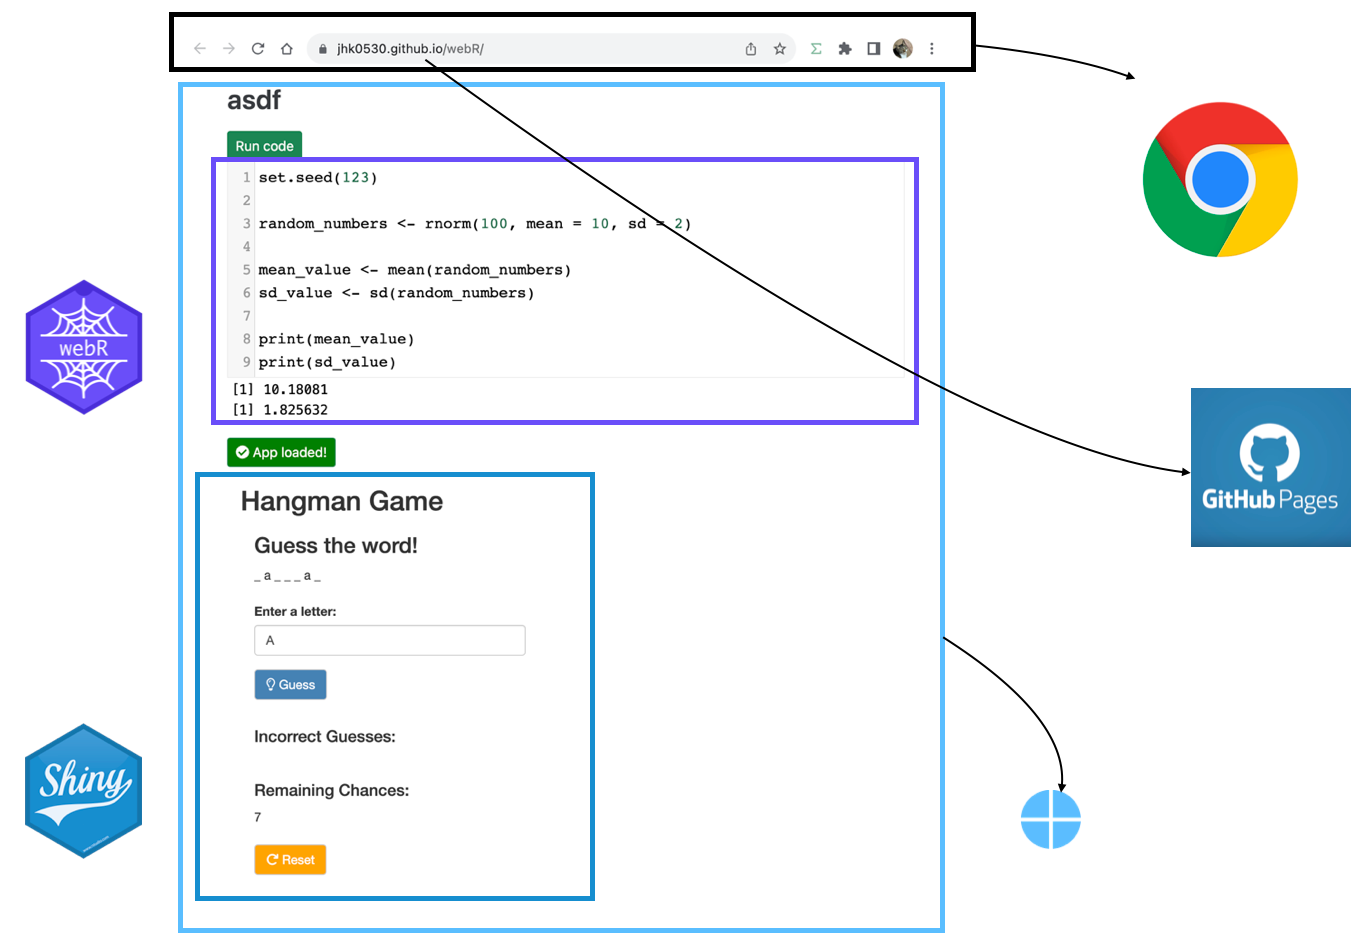
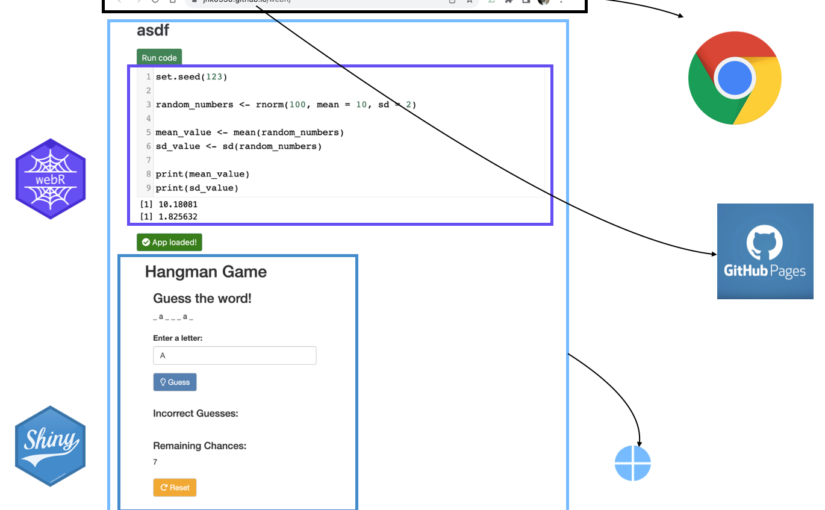
I made shiny application in github page with quarto.
You can check code in my github repository and result, result2
How we use shiny
Shiny is R package to make user utilize R with web browser without install it.
So my company utilizes shiny to provide statistical analysis for doctors (who don’t know R but need statistics).

Behind shiny
As you know, shiny is consisted with 2 part. UI and Server
You may think just UI is channel to both get input (data) from user and return calculated output (result) to user.
and server is just calculator
It means, server requires dynamic calculation that may change, not fixed contents (it called as static web page)
To achieve dynamic calculation, there are several options.
We can use shinyapps.io, posit connect, or deploy own shiny server in other cloud like AWS / azure / GCP …
These options can be categorized into two main categories: free but with limited features, or feature-rich but paid.

There is no single right answer, but I use shinyapps.io in see toy level project or deploy using shiny server in company’s cloud server which is not just toy level.
The rise of webR
Recent, webassembly (wasm) has emerged. that is use programming language in web browser (like Chrome) without install it (via javascript)
As far as I know, webR (R version of wasm) is built from late 2022 and some Examples are being shared to make R available on the web.
I understand logic for webR like just below figure. (but understanding is not necessary to run)

Shiny with wasm
For shiny, there is already wasm application called shinylive. but it utilizes shiny for Python.
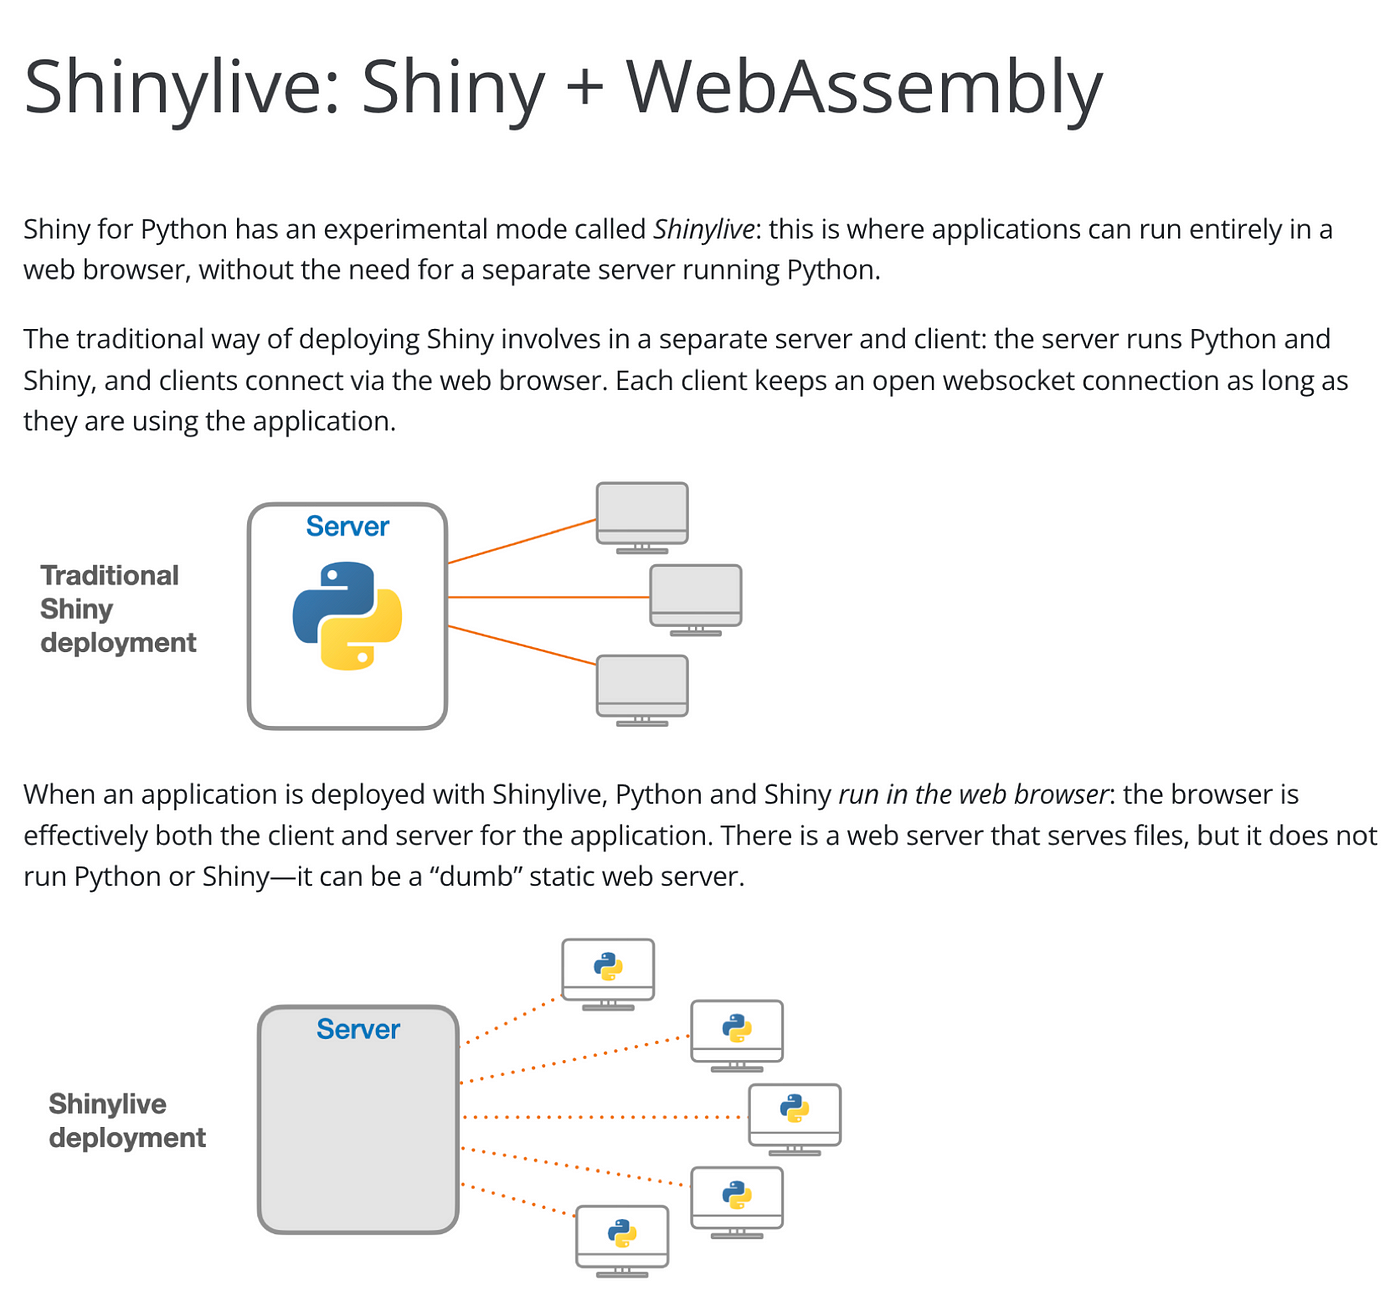
Personally, I’m not familiar with this. Since I used R for a long time
so I wasn’t interested in this.
but very recent, The article has been shared with appsilon’s shiny weekly newsletter.
and Leemput explains how to implant webR and shiny application in WordPress very kindly.
Since wordpress provides a static page service, this means that shiny can be planted using the github page I’m familiar with. (There are examples with netlify. so I think static page service like Vercel, Notion, Firebase or even medium may use webR)
The logic is just below. (as I understand)

note, Main difference with webR and shiny wasm is service worker
Let’s Build it
To build serverless shiny application with github page, we need 3 + 1 things.
1. HTML contents (button to show status of wasm and iframe for shiny applicaiton)
2. shiny code (app.R, we’ll utilize pre-made and publicly avaiable app)
3. javascript to run service worker (web worker + serivce worker)
and hard thing.
4. configuration for github page to utilize service worker via proxy.
we can utilize the resources provided by Leemput. (HTML contents and javascript code)
so let’s make index.qmd like below (you can check in my repo too)
Important: Change html to “{=html}”. I changed it since it breaks wordpress site.
---
title: "serverless shiny with github page"
include-in-header:
text: |
  <script> type='application/javascript' src = 'enable-threads.js' </script>
---

```html
<button class="btn btn-success btn-sm" type="button" style="background-color: dodgerblue" id="statusButton">
  <i class="fas fa-spinner fa-spin"></i>
  Loading webR...
</button>
<div id="iframeContainer"></div>
<script defer src="<https://use.fontawesome.com/releases/v5.15.4/js/all.js>" integrity="sha384-rOA1PnstxnOBLzCLMcre8ybwbTmemjzdNlILg8O7z1lUkLXozs4DHonlDtnE7fpc" crossorigin="anonymous"></script>
<script type="module">
  import { WebR } from '<https://webr.r-wasm.org/latest/webr.mjs>';
  const webR = new WebR();
  // TODO
  const shinyScriptURL = '<https://raw.githubusercontent.com/rstudio/shiny/main/inst/examples/01_hello/app.R>'
  const shinyScriptName = 'app.R'
  let webSocketHandleCounter = 0;
  let webSocketRefs = {};
  const loadShiny = async () => {
    try {
      document.getElementById('statusButton').innerHTML = `
        <i class="fas fa-spinner fa-spin"></i>
        Setting up websocket proxy and register service worker`;
      class WebSocketProxy {
        url;
        handle;
        bufferedAmount;
        readyState;
        constructor(_url) {
          this.url = _url
          this.handle = webSocketHandleCounter++;
          this.bufferedAmount = 0;
          this.shelter = null;
          webSocketRefs[this.handle] = this;
          webR.evalRVoid(`
                        onWSOpen <- options('webr_httpuv_onWSOpen')[[1]]
                        if (!is.null(onWSOpen)) {
                          onWSOpen(${this.handle},list(handle = ${this.handle}))
                        }`)
          setTimeout(() => {
            this.readyState = 1;
            this.onopen()},
            0);
        }
        async send(msg) {
          webR.evalRVoid(`
          onWSMessage <- options('webr_httpuv_onWSMessage')[[1]]
          if (!is.null(onWSMessage)) {onWSMessage(${this.handle}, FALSE, '${msg}')}
          `)
        }
      }
      await webR.init();
      console.log('webR ready');
      (async () => {
        for (; ;) {
          const output = await webR.read();
          switch (output.type) {
            case 'stdout':
              console.log(output.data)
              break;
            case 'stderr':
              console.log(output.data)
              break;
            case '_webR_httpuv_TcpResponse':
              const registration = await navigator.serviceWorker.getRegistration();
              registration.active.postMessage({
                type: "wasm-http-response",
                uuid: output.uuid,
                response: output.data,
              });
              break;
            case '_webR_httpuv_WSResponse':
              const event = { data: output.data.message };
              webSocketRefs[output.data.handle].onmessage(event);
              console.log(event)
              break;
          }
        }
      })();
      // TODO
      const registration = await navigator.serviceWorker.register('/wasmR/httpuv-serviceworker.js', { scope: '/wasmR/' }).catch((error) => {
      console.error('Service worker registration error:', error);
      });
      if ('serviceWorker' in navigator) {
        navigator.serviceWorker.getRegistration()
          .then((registration) => {
            if (registration) {
              const scope = registration.scope;
              console.log('Service worker scope:', scope);
            } else {
              console.log('No registered service worker found.');
            }
          })
          .catch((error) => {
            console.error('Error retrieving service worker registration:', error);
          });
      } else {
        console.log('Service workers not supported.');
      }
      await navigator.serviceWorker.ready;
      window.addEventListener('beforeunload', async () => {
        await registration.unregister();
      });
      console.log("service worker registered");
      document.getElementById('statusButton').innerHTML = `
        <i class="fas fa-spinner fa-spin"></i>
        Downloading R script...
      `;
      await webR.evalR("download.file('" + shinyScriptURL + "', '" + shinyScriptName + "')");
      console.log("file downloaded");
      document.getElementById('statusButton').innerHTML = `
        <i class="fas fa-spinner fa-spin"></i>
        Installing packages...
      `;
      await webR.installPackages(["shiny", "jsonlite"])
      document.getElementById('statusButton').innerHTML = `
        <i class="fas fa-spinner fa-spin"></i>
        Loading app...
      `;
      webR.writeConsole(`
          library(shiny)
          runApp('` + shinyScriptName + `')
      `);
      // Setup listener for service worker messages
      navigator.serviceWorker.addEventListener('message', async (event) => {
        if (event.data.type === 'wasm-http-fetch') {
          var url = new URL(event.data.url);
          var pathname = url.pathname.replace(/.*\\/__wasm__\\/([0-9a-fA-F-]{36})/, "");
          var query = url.search.replace(/^\\?/, '');
          webR.evalRVoid(`
                     onRequest <- options("webr_httpuv_onRequest")[[1]]
                     if (!is.null(onRequest)) {
                       onRequest(
                         list(
                           PATH_INFO = "${pathname}",
                           REQUEST_METHOD = "${event.data.method}",
                           UUID = "${event.data.uuid}",
                           QUERY_STRING = "${query}"
                         )
                       )
                     }
                     `);
        }
      });
      // Register with service worker and get our client ID
      const clientId = await new Promise((resolve) => {
        navigator.serviceWorker.addEventListener('message', function listener(event) {
          if (event.data.type === 'registration-successful') {
            navigator.serviceWorker.removeEventListener('message', listener);
            resolve(event.data.clientId);
            console.log("event data:")
            console.log(event.data)
          }
        });
        registration.active.postMessage({ type: "register-client" });
      });
      console.log('I am client: ', clientId);
      console.log("serviceworker proxy is ready");
      // Load the WASM httpuv hosted page in an iframe
      const containerDiv = document.getElementById('iframeContainer');
      let iframe = document.createElement('iframe');
      iframe.id = 'app';
      iframe.src = `./__wasm__/${clientId}/`;
      iframe.frameBorder = '0';
      iframe.style.width = '100%';
      iframe.style.height = '600px'; // Adjust the height as needed
      iframe.style.overflow = 'auto';
      containerDiv.appendChild(iframe);
      // Install the websocket proxy for chatting to httpuv
      iframe.contentWindow.WebSocket = WebSocketProxy;
      document.getElementById('statusButton').innerHTML = `
          <i class="fas fa-check-circle"></i>
          App loaded!
      `;
      document.getElementById('statusButton').style.backgroundColor = 'green';
      console.log("App loaded!");
    } catch (error) {
      console.log("Error:", error);
      document.getElementById('statusButton').innerHTML = `
        <i class="fas fa-times-circle"></i>
        Something went wrong...
      `;
      document.getElementById('statusButton').style.backgroundColor = 'red';
    }
  };
  loadShiny();
</script>
```
note that, there is 4 code that you must notice.
Line 3–4add header toenable-thread.js: github page has some permissions-policy (CORB / COOP / COEP) that blocks resource from other source page. so add this to enable it.Line 7add “=html” to HTML code in quarto (not just show it)First TODOset app.R code via URL: I tried to include in repo and call it likerepo/app.R, but it didn’t work. so uploadapp.Rin your repo and call it with raw file URLLast TODOregister service worker along your github page:
in registration, above code use/wasmR/httpuv-serviceworker.jsand scope/wasmR/but you must change to wasmR as your repository name.
after complete index.qmd. render it to index.html
but result will not show in localhost.
Remain step is so easy.
- just commit your work to repository,
- and build github page with that.
- In page setting, do not use
/docs, just/ (root)only worked for me. even set quarto project to render output in/docs
Summary
We’ve seen how to deploy shiny as a github page with a simple example.
Let’s summarize some of the pros and cons of this method.
Pros
- You can deploy simple shinyapp with static page (github page)
- You don’t need to consider cost / scale / performance since wasm uses client (User) ‘s PC.
- You can extend your shiny app with other framework like react, vue, tailwind… since shinyapp only requires just iframe and javascript code.
- You don’t need to consider deploy. (Github will do that)
Cons
- webR is in really really really earlier stage. so it doesn’t have much references, resources to refer.
- wasm shiny application requires time to initiate webR and shiny in chrome (this is critical, it takes so much time sometime randomly)
- (as Leemput already mentioned) why shiny? we can just use common web framework as UI and input, then utilize just webR not shiny.
- Heavier work (like file I/O) doesn’t supports yet in wasm shiny.
Future work?
I think some can be improved.
- use javascript as separate file (in qmd’s module script) : so quarto only requires iframe and button
- use app.R via repo not URL
- render quarto page to /docs not root: with this, quarto blog can use wasm shiny application well.
- research about what can be done or not via wasm shiny application. )I checked file upload / download can’t)
Other ways to use webR
You may note that, there are other options to build shiny webR using golem framework. (I’ll not brief them)
- https://github.com/DivadNojnarg/golemWebR
- https://github.com/RinteRface/webR4Shiny
- https://golem-webr.rinterface.com/
There is quarto template use webR (not supports shiny yet)
Thanks to community
- George Stagg for
httpuv-serviceworker.js - Joseph rocca for
enable-thread.js - Veerle van Leemput for kind introduction and help
If you have question or some ideas. Let’s talk!
Deep Learning with torch in R workshop
Join our workshop on Introduction to Deep Learning with torch in R, which is a part of our workshops for Ukraine series!
Here’s some more info:
Title: Deep Learning with torch in R
Date: Thursday, September 28th, 18:00 – 20:00 CEST (Rome, Berlin, Paris timezone)
Speaker: Daniel Falbel, Daniel is a software engineer at Posit and maintains the ‘torch’ R package and its ecosystem. He previously maintained the TensorFlow and Keras packages.
Description: Deep Learning has grown exponentially in recent years and has powered breakthroughs in fields such as computer vision and natural language processing. In this workshop you will learn the basics of torch and its ecosystem, build and train deep learning models with torch.
Minimal registration fee: 20 euro (or 20 USD or 800 UAH)
How can I register?
- Go to https://bit.ly/3wvwMA6 or https://bit.ly/3PFxtNA and donate at least 20 euro. Feel free to donate more if you can, all proceeds go directly to support Ukraine.
- Save your donation receipt (after the donation is processed, there is an option to enter your email address on the website to which the donation receipt is sent)
- Fill in the registration form, attaching a screenshot of a donation receipt (please attach the screenshot of the donation receipt that was emailed to you rather than the page you see after donation).
If you are not personally interested in attending, you can also contribute by sponsoring a participation of a student, who will then be able to participate for free. If you choose to sponsor a student, all proceeds will also go directly to organisations working in Ukraine. You can either sponsor a particular student or you can leave it up to us so that we can allocate the sponsored place to students who have signed up for the waiting list.
How can I sponsor a student?
- Go to https://bit.ly/3wvwMA6 or https://bit.ly/3PFxtNA and donate at least 20 euro (or 17 GBP or 20 USD or 800 UAH). Feel free to donate more if you can, all proceeds go to support Ukraine!
- Save your donation receipt (after the donation is processed, there is an option to enter your email address on the website to which the donation receipt is sent)
- Fill in the sponsorship form, attaching the screenshot of the donation receipt (please attach the screenshot of the donation receipt that was emailed to you rather than the page you see after the donation). You can indicate whether you want to sponsor a particular student or we can allocate this spot ourselves to the students from the waiting list. You can also indicate whether you prefer us to prioritize students from developing countries when assigning place(s) that you sponsored.
If you are a university student and cannot afford the registration fee, you can also sign up for the waiting list here. (Note that you are not guaranteed to participate by signing up for the waiting list).
You can also find more information about this workshop series, a schedule of our future workshops as well as a list of our past workshops which you can get the recordings & materials here.
Looking forward to seeing you during the workshop!
An Introduction to Bayesian A/B Testing in Stan, R, and Python workshop
Join our workshop on Introduction to An Introduction to Bayesian A/B Testing in Stan, R, and Python, which is a part of our workshops for Ukraine series!
Here’s some more info:
Title: An Introduction to Bayesian A/B Testing in Stan, R, and Python
Date: Thursday, September 14th, 18:00 – 20:00 CEST (Rome, Berlin, Paris timezone)
Speaker: Jordan Nafa is a Data Scientist at Game Data Pros, Inc. where his work centers around Bayesian A/B Testing, stochastic optimization, and applied causal inference for revenue optimization, promotional pricing, and personalized targeting in video games. He is also a Ph.D. Candidate in Political Science at the University of North Texas where he previously taught undergraduate courses in causal inference, applied statistics, and American political behavior.
Description: This workshop will cover a basic introduction to Bayesian inference, A/B Testing, and decision theory for the analysis of large-scale field experiments in industry settings. After introducing the foundations of the Bayesian approach to A/B Testing, we will work through real-world examples using the probabilistic programming language Stan along with its R and Python interfaces.
Minimal registration fee: 20 euro (or 20 USD or 800 UAH)
How can I register?
- Go to https://bit.ly/3wvwMA6 or https://bit.ly/3PFxtNA and donate at least 20 euro. Feel free to donate more if you can, all proceeds go directly to support Ukraine.
- Save your donation receipt (after the donation is processed, there is an option to enter your email address on the website to which the donation receipt is sent)
- Fill in the registration form, attaching a screenshot of a donation receipt (please attach the screenshot of the donation receipt that was emailed to you rather than the page you see after donation).
If you are not personally interested in attending, you can also contribute by sponsoring a participation of a student, who will then be able to participate for free. If you choose to sponsor a student, all proceeds will also go directly to organisations working in Ukraine. You can either sponsor a particular student or you can leave it up to us so that we can allocate the sponsored place to students who have signed up for the waiting list.
How can I sponsor a student?
- Go to https://bit.ly/3wvwMA6 or https://bit.ly/3PFxtNA and donate at least 20 euro (or 17 GBP or 20 USD or 800 UAH). Feel free to donate more if you can, all proceeds go to support Ukraine!
- Save your donation receipt (after the donation is processed, there is an option to enter your email address on the website to which the donation receipt is sent)
- Fill in the sponsorship form, attaching the screenshot of the donation receipt (please attach the screenshot of the donation receipt that was emailed to you rather than the page you see after the donation). You can indicate whether you want to sponsor a particular student or we can allocate this spot ourselves to the students from the waiting list. You can also indicate whether you prefer us to prioritize students from developing countries when assigning place(s) that you sponsored.
If you are a university student and cannot afford the registration fee, you can also sign up for the waiting list here. (Note that you are not guaranteed to participate by signing up for the waiting list).
You can also find more information about this workshop series, a schedule of our future workshops as well as a list of our past workshops which you can get the recordings & materials here.
Looking forward to seeing you during the workshop!
Benchmarking API Performance: R-Native and Plumber in Data Extraction and Sending
R, a language best known for its prowess in statistical analysis and data science, might not be the first choice that comes to mind when thinking about building APIs. However, rapid prototyping, scalability, seamless integration with data analysis, and ease of debugging are reasons for me to encapsulate API functionality within R packages. In doing so, I like to distinguish between two approaches:
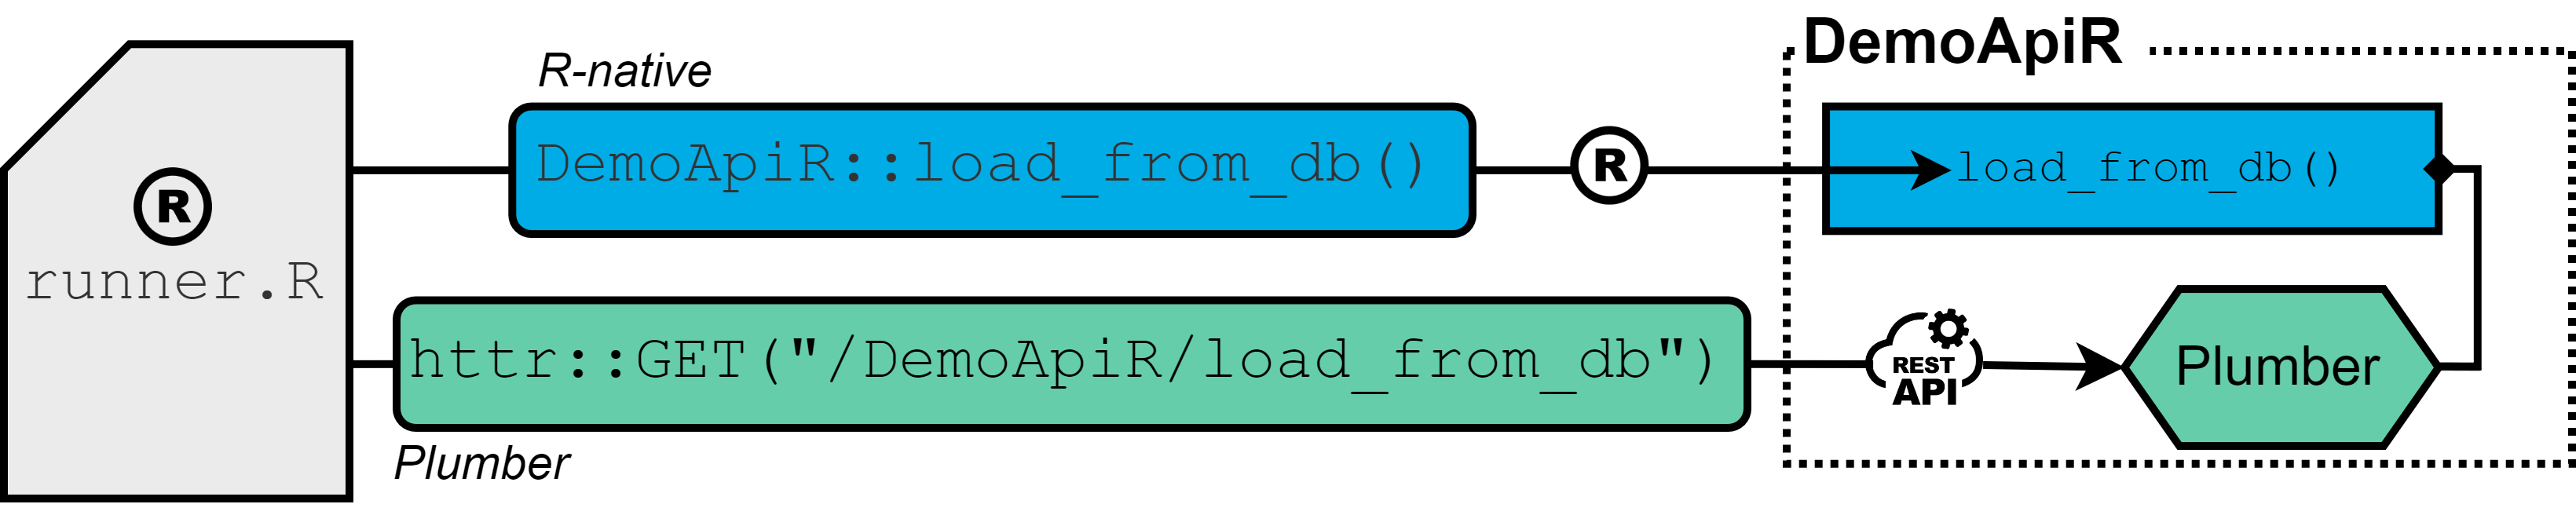
The R-native approach (blue): API interaction is available by functions of relevant R-packages that are directly installed into the R-session.
The Plumber approach (green): The Plumber package allows R code to be exposed as a RESTful web service through special decorator comments. As a results, API functionality is assesed by sending REST calls (GET, POST, …) rather than calling functions of R-packages directly.
Which approach to use?
The R-native approach (blue): API interaction is available by functions of relevant R-packages that are directly installed into the R-session.
The Plumber approach (green): The Plumber package allows R code to be exposed as a RESTful web service through special decorator comments. As a results, API functionality is assesed by sending REST calls (GET, POST, …) rather than calling functions of R-packages directly.
#* This endpoint is a dummy for loading data
#* @get load_from_db
#* @serializer unboxedJSON
#* @param row_limit :int
#* @response 200 OK with result
#* @response 201 OK without result
#* @response 401 Client Error: Invalid Request - Class
#* @response 402 Client Error: Invalid Request - Type
#* @response 403 Client Error: Missing or invalid parameter
#* @response 500 Server Error: Unspecified Server error
#* @response 501 Server Error: Database writing failed
#* @response 502 Server Error: Database reading failed
#* @tag demo
function(res, row_limit = 10000) {
   # load data from db
   data <- dplyr::tibble()
   res$status <- 200
   res$body <- as.list(data)
   return(res$body)
}
Which approach to use?
Certainly, both approaches have their strengths and limitations. It should be no surprise, that in terms of execution time, CPU utilization and format consistency, the R-native approach is likely to be the first choice, as code and data is processed within one context. Furthermore, the approach offers flexibility for complex data manipulations, but can be challenging when it comes to maintenance, especially propagating new releases of packages to all relevant processes and credential management. To the best of my knowledge, there is no automated way of re-installing new releases directly into all related R-packages, even with using the POSIT package manager – so this easily becomes tedious.
In contrast, the Plumber API encourages modular design that enhances code organization and facilitates integration with a wide array of platforms and systems. It streamlines package updates while ensuring a consistent interface. This means that interacting with a Plumber API remains separate from the underlying code logic provided by the endpoint. This approach not only improves version management but also introduces a clear separation between the client and server. In general, decoupling functionality through a RESTful API offers the possibility of dividing tasks into separate development teams more easily and thus a higher degree of flexibility and external support. Additionally, I found distributing a Plumber API notably more straightforward than handing over a raw R package.
The primary goal of this blog post is to quantify the performance difference between the two approaches when it comes to getting data in and out of a database. Such benchmark can be particularly valuable for ETL (Extract, Transform, Load) processes, thereby shedding light on the threshold at which the advantages of the Plumber approach cease to justify its constraints. In doing so, we hope to provide information to developers who are faced with the decision of whether it makes sense to provide or access R functionalities via Plumber APIs.
Experimental Setup
The experimental setup encompassed a virtual machine instance equipped with 64GB RAM and an Intel(R) Xeon(R) Gold 6152 CPU clocked at 2.1GHz, incorporating 8 kernels, running Ubuntu 22.04 LTS, hosting the POSIT Workbench and Connect server (for hosting the Plumber API) and employing R version v4.2.1. Both POSIT services were granted identical access permissions to the virtual machine’s computational resources.
Both approaches are evaluated in terms of execution times, simply measured with system.time(), and maximal observed CPU load, the latter being expecially an important indicator on how how much data can be extracted and send at once. For each fixed number of data row, ranging from 10^4 to 10^7, 10 trials are being conducted and results beeing plotted by using a jittered beeswarm plot. For assessing the cpu load during the benchmark, I build a separate function that returns a new session object, within which every 10 seconds the output of NCmisc::top(CPU = FALSE) is appended to a file.
get_cpu_load <- function(interval = 10, root, name, nrow) {
  rs_cpu <- callr::r_session$new()
  rs_cpu$call(function(nrow, root, name, interval) {
    files <- list.files(root)
    n_files <- sum(stringr::str_detect(files, sprintf("%s_%s_", name, format(nrow, scientific = FALSE))))
    l <- c()
    while (TRUE) {
      ret <- NCmisc::top(CPU = FALSE)
      l <- c(l, ret$RAM$used * 1000000)
      save(l, file = sprintf("%s/%s_%s_%s.rda", root, name, format(nrow, scientific = FALSE), n_files + 1))
      Sys.sleep(interval)
    }
  }, args = list(nrow, root, name, interval))
  return(rs_cpu)
}
Result
Execution time: in the following figure A), the data extraction process is observed to be approximately 10 times slower, when utilizing the plumber API as compared to the R-native approach across all dataset sizes.
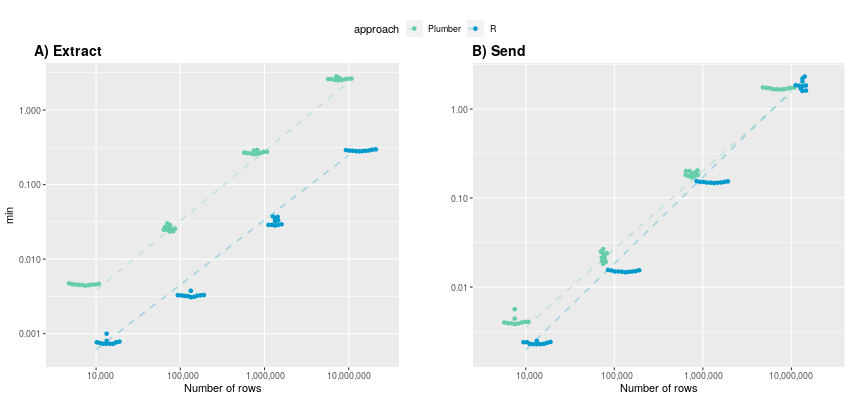
(y-axis in logarithmic scale)
Both approaches display a linear increase in execution time on a logarithmic time scale, indicating exponential growth in the original data domain. Specifically, the mean execution times for R-native and Plumber start at 0.00078 and 0.00456 minutes, respectively, and escalate to 0.286 and 2.61 minutes. It is reasonable to assume that this exponential trend persists for larger datasets, potentially resulting in execution times exceeding half an hour for very large tables (> 100 million rows) when using Plumber.
Conversely, subfigure B) shows the execution time for sending data and illustrates that both approaches provide rather comparable performance, particularly with larger numbers of rows. While for 10,000 rows, the R-native approach is still twice as fast (average of 0.0023 minutes) compared to Plumber (0.00418), the advantage of being in one context diminishes as the number of rows increases. At 10 million rows, the Plumber approach is even faster than the R-native approach (1.88 min), averaging 1.7 minutes. Once again, the execution time exhibits an exponential growth trend with an increasing number of rows.
CPU Load: In examining maximum observable CPU load during data receiving and sending, notable differences emerge between the Plumber API and the R-native approach.
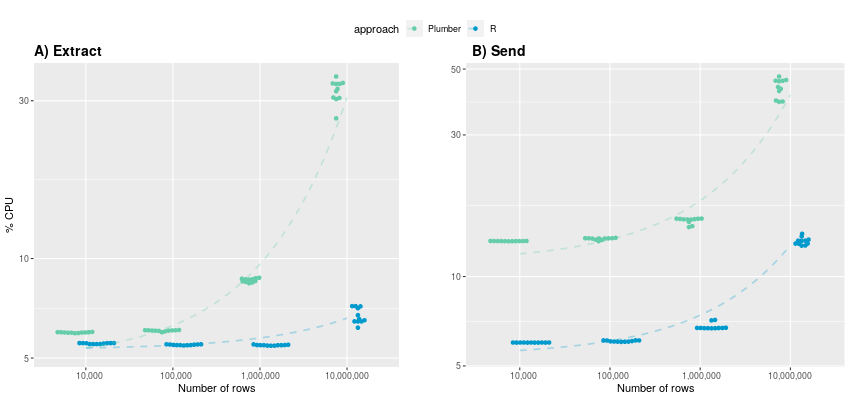
(y-axis in logarithmic scale)
A) For data extraction up to 1 million rows, CPU utilization remains below 10% for both approaches. However, the utilization patterns diverge as row counts increase. Notably, the R-native approach maintains relatively consistent CPU usage (averaging 5.53%, 5.48%, 5.47%) up to 1 million rows, whereas the Plumber approach already experiences a noticeable increase (5.97%, 6.05%, 8.6%). When extracting 10 million rows, CPU usage surpasses 30% for Plumber, while R-native extraction incurs approximately five times less computational overhead. B) In contrast to execution time, a clear difference in CPU utilization becomes evident also during sending data. The R-native approach consistently demonstrates at least half as less CPU demands compared to Plumber across all data row sizes. For 10,000,000 rows, the plumber approach even consumes over three times more CPU power: 13.1% vs. 43.2%. This makes up to almost 30GB in absolute terms.
The Plumber approach, while offering several advantages, encounters clear limitations when dealing with large datasets, be it tables with a substantial number of rows or extensive columns. As a result, data extraction becomes roughly ten times slower, with CPU utilization being up to five and three times higher during getting data out and in, respectively. Digging deeper into it reveals that this gap is likely to result from the necessity of converting data into JSON format when using a web-based architecture. Plumber can’t handle R dataframes directly, which is why serializer have to to be used before sending and retrieving data from an endpoint. Even with lots of RAM capacity, this conversion process can lead to execution errors in practice as JSON representations may surpass the allowed byte size for the R datatype character.
>jsonlite::toJSON(dataframe)
Error in collapse_object(objnames, tmp, indent):
R character strings are limited to 2^31-1 bytes
The only viable workaround in such scenarios involves breaking down tables into smaller chunks based on certain identifiers.
Providing a precise table size limitation where the Plumber approach remains suitable proves challenging, as it hinges on a multitude of factors, including the number of rows, columns, and cell content within the dataset. Personally, I will stick to using the Plumber API for scenarios with limited data traffic, such as querying terminology or a statistical summary, as I generally prioritize code encapsulation and ease of maintenance over maximizing performance.
Micha Christ
Bosch Health Campus Centrum für Medizinische Datenintegration