This is a brief market update from my earlier post on October 28, 2021, Walmart’s 7-Year Nonlinear Market Trend using ‘Stealth Curves.’
The prior post indicated the then current nonlinear market structure for Walmart (WMT) stock.
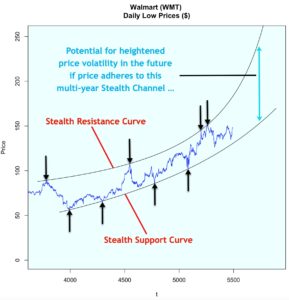
October 28, 2021 Market View
Fast forward to today …
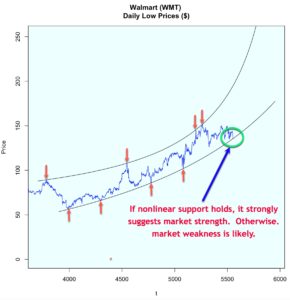
This market is now resting on its multi-year lower Stealth Support Curve. As the below updated graphic indicates, this represents a critical juncture for this market.
Current Market View (1-27-2022)
This current chart can be produced using the code in my October 2021 post along with updated market data. The data is freely available from Nasdaq.com here. Just be certain the updated data match the column headings in my ‘reformatted’ GitHub data file.
For those interested in numerous Stealth Curve examples applied to various other markets, simply view this LinkedIn post. Full details of Stealth Curve equation parameterization are described in my latest Amazon publication, Stealth Curves: The Elegance of ‘Random’ Markets.
Feel free to contact me directly on my LinkedIn site.
Brian K. Lee, MBA, PRM, CMA, CFA