First we load the required packages (use
install.packages() first if these are not already installed in R):library(sf)
library(dplyr)
library(ggplot2)
Data generation
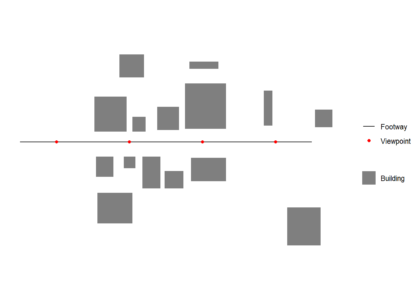
First we create and plot an example footway with viewpoints and set of buildings which block views. All data used should be in the same Coordinate Reference System (CRS). We generate one viewpoint every 50 m (note density here is a function of the st_crs() units, in this case meters)library(sf)
footway <- st_sfc(st_linestring(rbind(c(-50,0),c(150,0))))
st_crs(footway) = 3035
viewpoints <- st_line_sample(footway, density = 1/50)
viewpoints <- st_cast(viewpoints,"POINT")
buildings <- rbind(c(1,7,1),c(1,31,1),c(23,31,1),c(23,7,1),c(1,7,1),
c(2,-24,2),c(2,-10,2),c(14,-10,2),c(14,-24,2),c(2,-24,2),
c(21,-18,3),c(21,-10,3),c(29,-10,3),c(29,-18,3),c(21,-18,3),
c(27,7,4),c(27,17,4),c(36,17,4),c(36,7,4),c(27,7,4),
c(18,44,5), c(18,60,5),c(35,60,5),c(35,44,5),c(18,44,5),
c(49,-32,6),c(49,-20,6),c(62,-20,6),c(62,-32,6),c(49,-32,6),
c(34,-32,7),c(34,-10,7),c(46,-10,7),c(46,-32,7),c(34,-32,7),
c(63,9,8),c(63,40,8),c(91,40,8),c(91,9,8),c(63,9,8),
c(133,-71,9),c(133,-45,9),c(156,-45,9),c(156,-71,9),c(133,-71,9),
c(152,10,10),c(152,22,10),c(164,22,10),c(164,10,10),c(152,10,10),
c(44,8,11),c(44,24,11),c(59,24,11),c(59,8,11),c(44,8,11),
c(3,-56,12),c(3,-35,12),c(27,-35,12),c(27,-56,12),c(3,-56,12),
c(117,11,13),c(117,35,13),c(123,35,13),c(123,11,13),c(117,11,13),
c(66,50,14),c(66,55,14),c(86,55,14),c(86,50,14),c(66,50,14),
c(67,-27,15),c(67,-11,15),c(91,-11,15),c(91,-27,15),c(67,-27,15))
buildings <- lapply( split( buildings[,1:2], buildings[,3] ), matrix, ncol=2)
buildings <- lapply(X = 1:length(buildings), FUN = function(x) {
st_polygon(buildings[x])
})
buildings <- st_sfc(buildings)
st_crs(buildings) = 3035
# plot raw data
ggplot() +
geom_sf(data = buildings,colour = "transparent",aes(fill = 'Building')) +
geom_sf(data = footway, aes(color = 'Footway')) +
geom_sf(data = viewpoints, aes(color = 'Viewpoint')) +
scale_fill_manual(values = c("Building" = "grey50"),
guide = guide_legend(override.aes = list(linetype = c("blank"),
nshape = c(NA)))) +
scale_color_manual(values = c("Footway" = "black",
"Viewpoint" = "red",
"Visible area" = "red"),
labels = c("Footway", "Viewpoint","Visible area"))+
guides(color = guide_legend(
order = 1,
override.aes = list(
color = c("black","red"),
fill = c("transparent","transparent"),
linetype = c("solid","blank"),
shape = c(NA,16))))+
theme_minimal()+
coord_sf(datum = NA)+
theme(legend.title=element_blank())
Isovist function
Function inputs
Buildings should be cast to"POLYGON" if they are not already
buildings <- st_cast(buildings,"POLYGON")
Creating the function
A few parameters can be set before running the function.rayno is the number of observer view angles from the viewpoint. More rays are more precise, but decrease processing speed.raydist is the maximum view distance. The function takessfc_POLYGON type and sfc_POINT objects as inputs for buildings abd the viewpoint respectively.
If points have a variable view distance the function can be modified by creating a vector of view distance of length(viewpoints) here and then selecting raydist[x] in st_buffer below.
Each ray is intersected with building data within its raycast distance, creating one or more ray line segments. The ray line segment closest to the viewpoint is then extracted, and the furthest away vertex of this line segement is taken as a boundary vertex for the isovist. The boundary vertices are joined in a clockwise direction to create an isovist.st_isovist <- function(
buildings,
viewpoint,
# Defaults
rayno = 20,
raydist = 100) {
# Warning messages
if(!class(buildings)[1]=="sfc_POLYGON") stop('Buildings must be sfc_POLYGON')
if(!class(viewpoint)[1]=="sfc_POINT") stop('Viewpoint must be sf object')
rayends <- st_buffer(viewpoint,dist = raydist,nQuadSegs = (rayno-1)/4)
rayvertices <- st_cast(rayends,"POINT")
# Buildings in raydist
buildintersections <- st_intersects(buildings,rayends,sparse = FALSE)
# If no buildings block max view, return view
if (!TRUE %in% buildintersections){
isovist <- rayends
}
# Calculate isovist if buildings block view from viewpoint
if (TRUE %in% buildintersections){
rays <- lapply(X = 1:length(rayvertices), FUN = function(x) {
pair <- st_combine(c(rayvertices[x],viewpoint))
line <- st_cast(pair, "LINESTRING")
return(line)
})
rays <- do.call(c,rays)
rays <- st_sf(geometry = rays,
id = 1:length(rays))
buildsinmaxview <- buildings[buildintersections]
buildsinmaxview <- st_union(buildsinmaxview)
raysioutsidebuilding <- st_difference(rays,buildsinmaxview)
# Getting each ray segement closest to viewpoint
multilines <- dplyr::filter(raysioutsidebuilding, st_is(geometry, c("MULTILINESTRING")))
singlelines <- dplyr::filter(raysioutsidebuilding, st_is(geometry, c("LINESTRING")))
multilines <- st_cast(multilines,"MULTIPOINT")
multilines <- st_cast(multilines,"POINT")
singlelines <- st_cast(singlelines,"POINT")
# Getting furthest vertex of ray segement closest to view point
singlelines <- singlelines %>%
group_by(id) %>%
dplyr::slice_tail(n = 2) %>%
dplyr::slice_head(n = 1) %>%
summarise(do_union = FALSE,.groups = 'drop') %>%
st_cast("POINT")
multilines <- multilines %>%
group_by(id) %>%
dplyr::slice_tail(n = 2) %>%
dplyr::slice_head(n = 1) %>%
summarise(do_union = FALSE,.groups = 'drop') %>%
st_cast("POINT")
# Combining vertices, ordering clockwise by ray angle and casting to polygon
alllines <- rbind(singlelines,multilines)
alllines <- alllines[order(alllines$id),]
isovist <- st_cast(st_combine(alllines),"POLYGON")
}
isovist
}
Running the function in a loop
It is possible to wrap the function in a loop to get multiple isovists for a multirowsfc_POINT object. There is no need to heed the repeating attributes for all sub-geometries warning as we want that to happen in this case.
isovists   <- lapply(X = 1:length(viewpoints), FUN = function(x) {
  viewpoint   <- viewpoints[x]
  st_isovist(buildings = buildings,
             viewpoint = viewpoint,
             rayno = 41,
             raydist = 100)
})
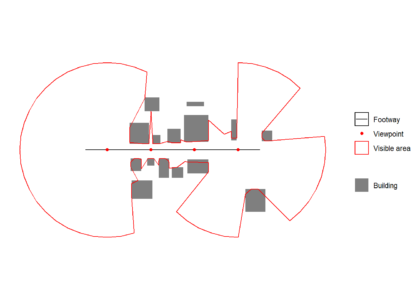
All isovists are unioned to create a visible area polygon, which can see plotted over the original path, viewpoint and building data below.isovists <- do.call(c,isovists)
visareapoly <- st_union(isovists)
ggplot() +
geom_sf(data = buildings,colour = "transparent",aes(fill = 'Building')) +
geom_sf(data = footway, aes(color = 'Footway')) +
geom_sf(data = viewpoints, aes(color = 'Viewpoint')) +
geom_sf(data = visareapoly,fill="transparent",aes(color = 'Visible area')) +
scale_fill_manual(values = c("Building" = "grey50"),
guide = guide_legend(override.aes = list(linetype = c("blank"),
shape = c(NA)))) +
scale_color_manual(values = c("Footway" = "black",
"Viewpoint" = "red",
"Visible area" = "red"),
labels = c("Footway", "Viewpoint","Visible area"))+
guides( color = guide_legend(
order = 1,
override.aes = list(
color = c("black","red","red"),
fill = c("transparent","transparent","white"),
linetype = c("solid","blank", "solid"),
shape = c(NA,16,NA))))+
theme_minimal()+
coord_sf(datum = NA)+
theme(legend.title=element_blank())