Garcia-Lerma E, Carmezim J, Satorra P, Peñafiel J, Pallares N, Santos N, Tebé C.
Biostatistics Unit, Bellvitge Biomedical Research Institute (IDIBELL)
The REDCapDM package allows users to read data exported directly from REDCap or via an API connection. It also allows users to process the previously downloaded data, create reports of queries and track the identified issues.
The diagram below shows the data management cycle: from data entry in REDCap to obtain data ready for the analysis.
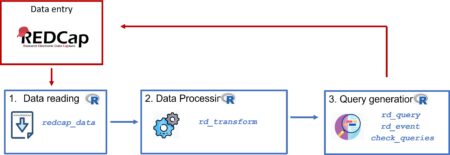
The package structure can be divided into three main components: reading raw data, processing data and identifying queries. Typically, after collecting data in REDCap, we will have to follow these three components in order to have a final validated dataset for analysis. We will provide a user guide on how to perform each one of these steps using the package’s functions. For data processing and query identification, we will use the COVICAN data as an example (see the package vignette for more information about this built-in dataset).
Read data: redcap_data
The redcap_data function allows users to easily import data from a REDCap project into R for analysis.
To read exported data from REDCap, use the arguments data_path and dic_path to, respectively, describe the path of the R file and the REDCap project’s dictionary:
dataset <- redcap_data(data_path="C:/Users/username/example.r",
dic_path="C:/Users/username/example_dictionary.csv")Note: The R and CSV files exported from REDCap must be located in the same directory.
If the REDCap project is longitudinal (contains more than one event) then a third element should be specified with the correspondence of each event with each form of the project. This csv file can be downloaded in the REDCap of the project following these steps: Project Setup < Designate Instruments for My Events < Download instrument-event mappings (CSV).
dataset <- redcap_data(data_path="C:/Users/username/example.r",
                       dic_path="C:/Users/username/example_dictionary.csv",
event_path="C:/Users/username/events.csv")Note: if the project is longitudinal and the event-form file is not provided using the event_path argument, some steps of the processment can not be performed.
Another way to read data exported from a REDCap project is using an API connection. To do this, we can use the arguments uri and token which respectively refer to the uniform resource identifier of the REDCap project and the user-specific string that serves as the password:
dataset_api <- redcap_data(uri ="https://redcap.idibell.cat/api/",
                           token = "55E5C3D1E83213ADA2182A4BFDEA")
In this case, there is no need to specify the event-form file since the function will download it automatically using the API connection, if the project is longitudinal.
Remember that the token would give anyone access to all the project’s information. You should be careful about who you give this information to.
This function returns a list with 3 elements (imported data, dictionary and event-form mapping) which can then be used for further analysis or visualization.
Data process: rd_transform
The main function involved in the processing of the data is rd_transform. This function is used to process the REDCap data read into R using the redcap_data, as described above. Using the arguments of the function we can perform different type of transformations of our data.
As previously stated, we will use the built-in dataset covican as an example.
The only necessary elements that must be provided are the dataset to be transformed and the corresponding dictionary. If the project is longitudinal, as in the case of covican, also the event-form dataset should be specified. These elements can be specified directly using the output of the redcap_data function or separately in different arguments.
#Option A: list object
covican_transformed <- rd_transform(covican)

#Option B: separately with different arguments
covican_transformed <- rd_transform(data = covican$data,
                                    dic = covican$dictionary,
                                    event_form = covican$event_form)

#Print the results of the transformation
covican_transformed$results
1. Recalculating calculated fields and saving them as '[field_name]_recalc'
| Total calculated fields | Non-transcribed fields | Recalculated different fields |
|:-----------------:|:----------------:|:-----------------------:|
| 2 | 0 (0%) | 1 (50%) |
| field_name | Transcribed? | Is equal? |
|:-------------------:|:------------:|:---------:|
| age | Yes | FALSE |
| screening_fail_crit | Yes | TRUE |
2. Transforming checkboxes: changing their values to No/Yes and changing their names to the names of its options. For checkboxes that have a branching logic, when the logic is missing their values will be set to missing
Table: Checkbox variables advisable to be reviewed
| Variables without any branching logic |
|:-------------------------------------:|
| type_underlying_disease |
3. Replacing original variables for their factor version
4. Deleting variables that contain some patternsThis function will return a list with the transformed dataset, dictionary and the output of the results of the transformation.
As we can see, there are 4 steps in the transformation and they are briefly explained in the output of the function. This four steps are:
-
-
-
-
Recalculation of REDCap calculated fields
-
Checkbox transformation
-
Replacement of the original variable by its factor version
-
Elimination of variables containing some pattern
-
-
-
In addition, we can change the final structure of the transformed dataset by specifying in the final_format argument whether we want our data to be split by event or by form.
For more examples and information on extra arguments, see the vignette.
Queries
Queries are very important to ensure the accuracy and reliability of a REDCap dataset. The collected data may contain missing values, inconsistencies, or other potential errors that need to be identified in order to correct them later.
For all the following examples we will use the raw transformed data: covican_transformed.
rd_query
The rd_query function allows users to generate queries by using a specific expression. It can be used to identify missing values, values that fall outside the lower and upper limit of a variable and other types of inconsistencies.
Missings
If we want to identify missing values in the variables copd and age in the raw transformed data, a list of required arguments needs to be supplied.
example <- rd_query(covican_transformed,
                    variables = c("copd", "age"),
                    expression = c("%in%NA", "%in%NA"),
                    event = "baseline_visit_arm_1")

# Printing results
example$results| Variables | Description | Event | Query | Total |
|---|---|---|---|---|
| copd | Chronic obstructive pulmonary disease | Baseline visit | The value should not be missing | 6 |
| age | Age | Baseline visit | The value should not be missing | 5 |
Expressions
The rd_query function is also able to identify outliers or observations that fulfill a specific condition.
example <- rd_query(variables="age",
                    expression=">70",
                    event="baseline_visit_arm_1",
                    dic=covican_transformed$dictionary,
                    data=covican_transformed$data)

# Printing results
example$results| Variables | Description | Event | Query | Total |
|---|---|---|---|---|
| age | Age | Baseline visit | The value should not be >70 | 76 |
More examples of both functions can be seen at the vignette.
Output
When the rd_query function is executed, it returns a list that includes a data frame with all the queries identified and a second element with a summary of the number of generated queries in each specified variable for each expression applied:
| Identifier | DAG | Event | Instrument | Field | Repetition | Description | Query | Code |
|---|---|---|---|---|---|---|---|---|
| 100-58 | Hospital 11 | Baseline visit | Comorbidities | copd | · | Chronic obstructive pulmonary disease | The value is NA and it should not be missing | 100-58-1 |
| Variables | Description | Event | Query | Total |
|---|---|---|---|---|
| copd | Chronic obstructive pulmonary disease | Baseline visit | The value should not be missing | 6 |
The data frame is designed to aid users in locating each query in their REDCap project. It includes information such as the record identifier, the Data Access Group (DAG), the event in which each query can be found, along with the name and the description of the analyzed variable and a brief description of the query.
check_queries
Once the process of identifying queries is complete, the typical approach would be to adress them by modifying the original dataset in REDCap and re-run the query identification process generating a new query dataset.
The check_queries function compares the previous query dataset with the new one by using the arguments old and new, respectively. The output remains a list with 2 items, but the data frame containing the information for each query will now have an additional column (“Modification”) indicating which queries are new, which have been modified, which have been corrected, and which remain pending. Besides, the summary will show the number of queries in each one of these categories:
check <- check_queries(old = example$queries,
                       new = new_example$queries)

# Print results
check$results| State | Total |
|---|---|
| Pending | 7 |
| Solved | 3 |
| Miscorrected | 1 |
| New | 1 |
There are 7 pending queries, 3 solved queries, 1 miscorrected query, and 1 new query between the previous and the new query dataset.
Note: The “Miscorrected” category includes queries that belong to the same combination of record identifier and variable in both the old and new reports, but with a different reason. For instance, if a variable had a missing value in the old report, but in the new report shows a value outside the established range, it would be classified as “Miscorrected”.
Query control output:
| Identifier | DAG | Event | Instrument | Field | Repetition | Description | Query | Code | Modification |
|---|---|---|---|---|---|---|---|---|---|
| 100-58 | Hospital 11 | Baseline visit | Comorbidities | copd | · | Chronic obstructive pulmonary disease | The value is NA and it should not be missing | 100-58-1 | Pending |
| 100-79 | Hospital 11 | Baseline visit | Comorbidities | copd | · | Chronic obstructive pulmonary disease | The value is NA and it should not be missing | 100-79-1 | New |
| 102-113 | Hospital 24 | Baseline visit | Demographics | age | · | Age | The value is NA and it should not be missing | 102-113-1 | Pending |
| 105-11 | Hospital 5 | Baseline visit | Comorbidities | copd | · | Chronic obstructive pulmonary disease | The value is NA and it should not be missing | 105-11-1 | Pending |
Future improvements
In the short term, we would like to make some improvements to the query identification and tracking process to minimise errors and cover a wide range of possible structures. We would also like to extend the scope of the data processing to cover up specific transformations of the data that may be required in some specific scenarios. As a long-term plan, we would like to complement this package with the development of a shiny application to facilitate the use of the package and make it as user-friendly as possible.