“Let`s shift to Disney+”, said my wife desperately browsing Netflix on her phone. “Netflix has much more fresh content” I argued. And…I realized I need numbers to close these family debates… I choose “2018 and later” criteria as “fresh” and “1999 and earlier” as “old”. Those criteria are not strict but I needed certainty to have completely quantified arguments to keep my Netflix on the family throne.
Since I did not find such numbers on both streaming services websites I decided to scrape full lists of movies and TV shows and calculate % of “fresh” / “old” movies in entire lists. Likely, there are different websites listing all movies and TV shows both on Disney+ and Netflix and updating them daily. I choose one based on popularity (I checked it both with Alexa and Similar Web) and its architecture making my scraping job easy and predictable.

library (tidyverse)
library (rvest)
disney0 <- read_html("https://www.finder.com/complete-list-disney-plus-movies-tv-shows-exclusives/")
Locate proper CSS element using Selector Gadget disney_year_0 <- html_nodes(disney0, 'td:nth-child(2)') disney_year <- html_text (disney_year_0, trim=TRUE) # list of release years for every title length (disney_year) #1029Now, let`s create frequency table for each year of release
disney_year_table <- as.data.frame (sort (table (disney_year), decreasing = TRUE), stringsAsFactors = FALSE)
colnames (disney_year_table) <- c('years', 'count')

glimpse (disney_year_table)
Rows: 89 Columns: 2 $ years  "2019", "2017", "2016", "2018", "2015", "2011", "2014", "2012", "2010", "200... $ count  71, 58, 48, 40, 36, 35, 35, 34, 31, 28, 28, 27, 27, 25, 24, 24, 23, 23, 21,
Finally, count ‘fresh’ and 'old' % in entire Disney+ offer
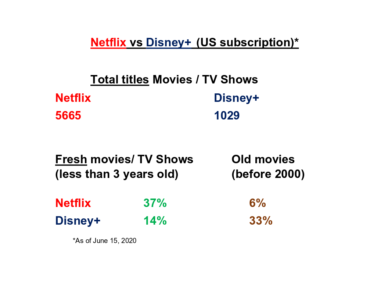
disney_year_table$years <- disney_year_table$years %>% as.numeric ()

fresh_disney_years <- disney_year_table$years %in% c(2018:2020)
fresh_disney_num <- paste (round (sum (disney_year_table$count[fresh_disney_years]) / sum (disney_year_table$count)*100),'%')

old_disney_years <- disney_year_table$years < 2000
old_disney_num <- paste (round (sum (disney_year_table$count[old_disney_years]) / sum (disney_year_table$count)*100),'%')
So, I`ve got roughly 14% “fresh” and 33% “old” movie on Disney+. Let`s see the numbers for Netflix.
For Netflix content our source website does not have single page so I scraped movies and TV shows separately.
#movies
netflix_mov0 <- read_html("https://www.finder.com/netflix-movies/")
netflix_mov_year_0 <- html_nodes(netflix_mov0, 'td:nth-child(2)')
netflix_mov_year <- tibble (html_text (netflix_mov_year_0, trim=TRUE))
colnames (netflix_mov_year) <- "year"

#TV shows
netflix_tv0 <- read_html("https://www.finder.com/netflix-tv-shows/")
netflix_tv_year_0 <- html_nodes(netflix_tv0, 'td:nth-child(2)')
netflix_tv_year <- tibble (html_text (netflix_tv_year_0, trim=TRUE))
colnames (netflix_tv_year) <- "year"
Code for final count of the at Neflix ‘fresh’ and ‘old’ movies / TV shows portions is almost the same as for Disney
netflix_year <- rbind (netflix_mov_year, netflix_tv_year)
nrow (netflix_year)
netflix_year_table <- as.data.frame (sort (table (netflix_year), decreasing = TRUE), stringsAsFactors = FALSE) colnames (netflix_year_table) <- c('years', 'count')

glimpse (netflix_year_table)
Rows: 68
Columns: 2
$ years  2018, 2019, 2017, 2016, 2015, 2014, 2020, 2013, 2012, 2010,
$ count  971, 882, 821, 653, 423, 245, 198, 184, 163, 127, 121, 108,
Count 'fresh' and 'old' % in entire offer
netflix_year_table$years <- netflix_year_table$years %>% as.numeric ()

fresh_netflix_years <- netflix_year_table$years %in% c(2018:2020)
fresh_netflix_num <- paste (round (sum (netflix_year_table$count[fresh_netflix_years]) / sum (netflix_year_table$count)*100),'%')

old_netflix_years <- netflix_year_table$years < 2000
old_netflix_years <- na.omit (old_netflix_years)
old_netflix_num <- paste (round (sum (netflix_year_table$count[old_netflix_years]) / sum (netflix_year_table$count)*100),'%')
So, finally, I can build my arguments based on numbers, freshly baked and bold
Or you could have agreed with your wife, watched a movie, and then while she was in a positive frame of mind?
My baby is also Data Analyst so you can`t buy her with just box of candies…
Hi Sir,
I found the analysis very interesting. So I wished to know what more possibilities can be considered, given that new entrants are going to be in competition like Warner Bros, HBO, and host of others. Also how data analysis be carried out to predict that existence of few or mergers etc. As of now I was studying this market as from microeconomics perspective .
Thank you, Mandar.
This market is emerging and interesting to research. I am more on content side. I am curious why people watch certain movies / TV shows and series, how and what they will watch in the future. You can connect me via LinkedIn or FB and we can discuss VOD and related markets more in depth.
Kind regards,
Andrew