Shiny, without server
In previous article, I introduced method to share shiny application in static web page (github page)At the core of this method is a technology called WASM, which is a way to load and utilize R and Shiny-related libraries and files that have been converted for use in a web browser. The main problem with wasm is that it is difficult to configure, even for R developers.
Of course, there was a way called shinylive, but unfortunately it was only available in python at the time.
Fortunately, after a few months, there is an R package that solves this configuration problem, and I will introduce how to use it to add a shiny application to a static page.
shinylive
shinylive is R package to utilize wasm above shiny. and now it has both Python and R version, and in this article will be based on the R version.shinylive is responsible for generating HTML, Javascript, CSS, and other elements needed to create web pages, as well as wasm-related files for using shiny.
You can see examples created with shinylive at this link.

Install shinylive
While shinylive is available on CRAN, it is recommended to use the latest version from github as it may be updated from time to time, with the most recent release being 0.1.1. Additionally,
pak is the recently recommended R package for installing R packages in posit, and can replace existing functions like install.packages() and remotes::install_github().# install.packages("pak")
pak::pak("posit-dev/r-shinylive")
You can think of shinylive as adding a wasm to an existing shiny application, which means you need to create a shiny application first.
For the example, we’ll use the code provided by shiny package (which you can also see by typing
shiny::runExample("01_hello") in the Rstudio console).library(shiny)
ui <- fluidPage(
titlePanel("Hello Shiny!"),
sidebarLayout(
sidebarPanel(
sliderInput(
inputId = "bins",
label = "Number of bins:",
min = 1,
max = 50,
value = 30
)
),
mainPanel(
plotOutput(outputId = "distPlot")
)
)
)
server <- function(input, output) {
output$distPlot <- renderPlot({
x <- faithful$waiting
bins <- seq(min(x), max(x), length.out = input$bins + 1)
hist(x,
breaks = bins, col = "#75AADB", border = "white",
xlab = "Waiting time to next eruption (in mins)",
main = "Histogram of waiting times"
)
})
}
shinyApp(ui = ui, server = server)
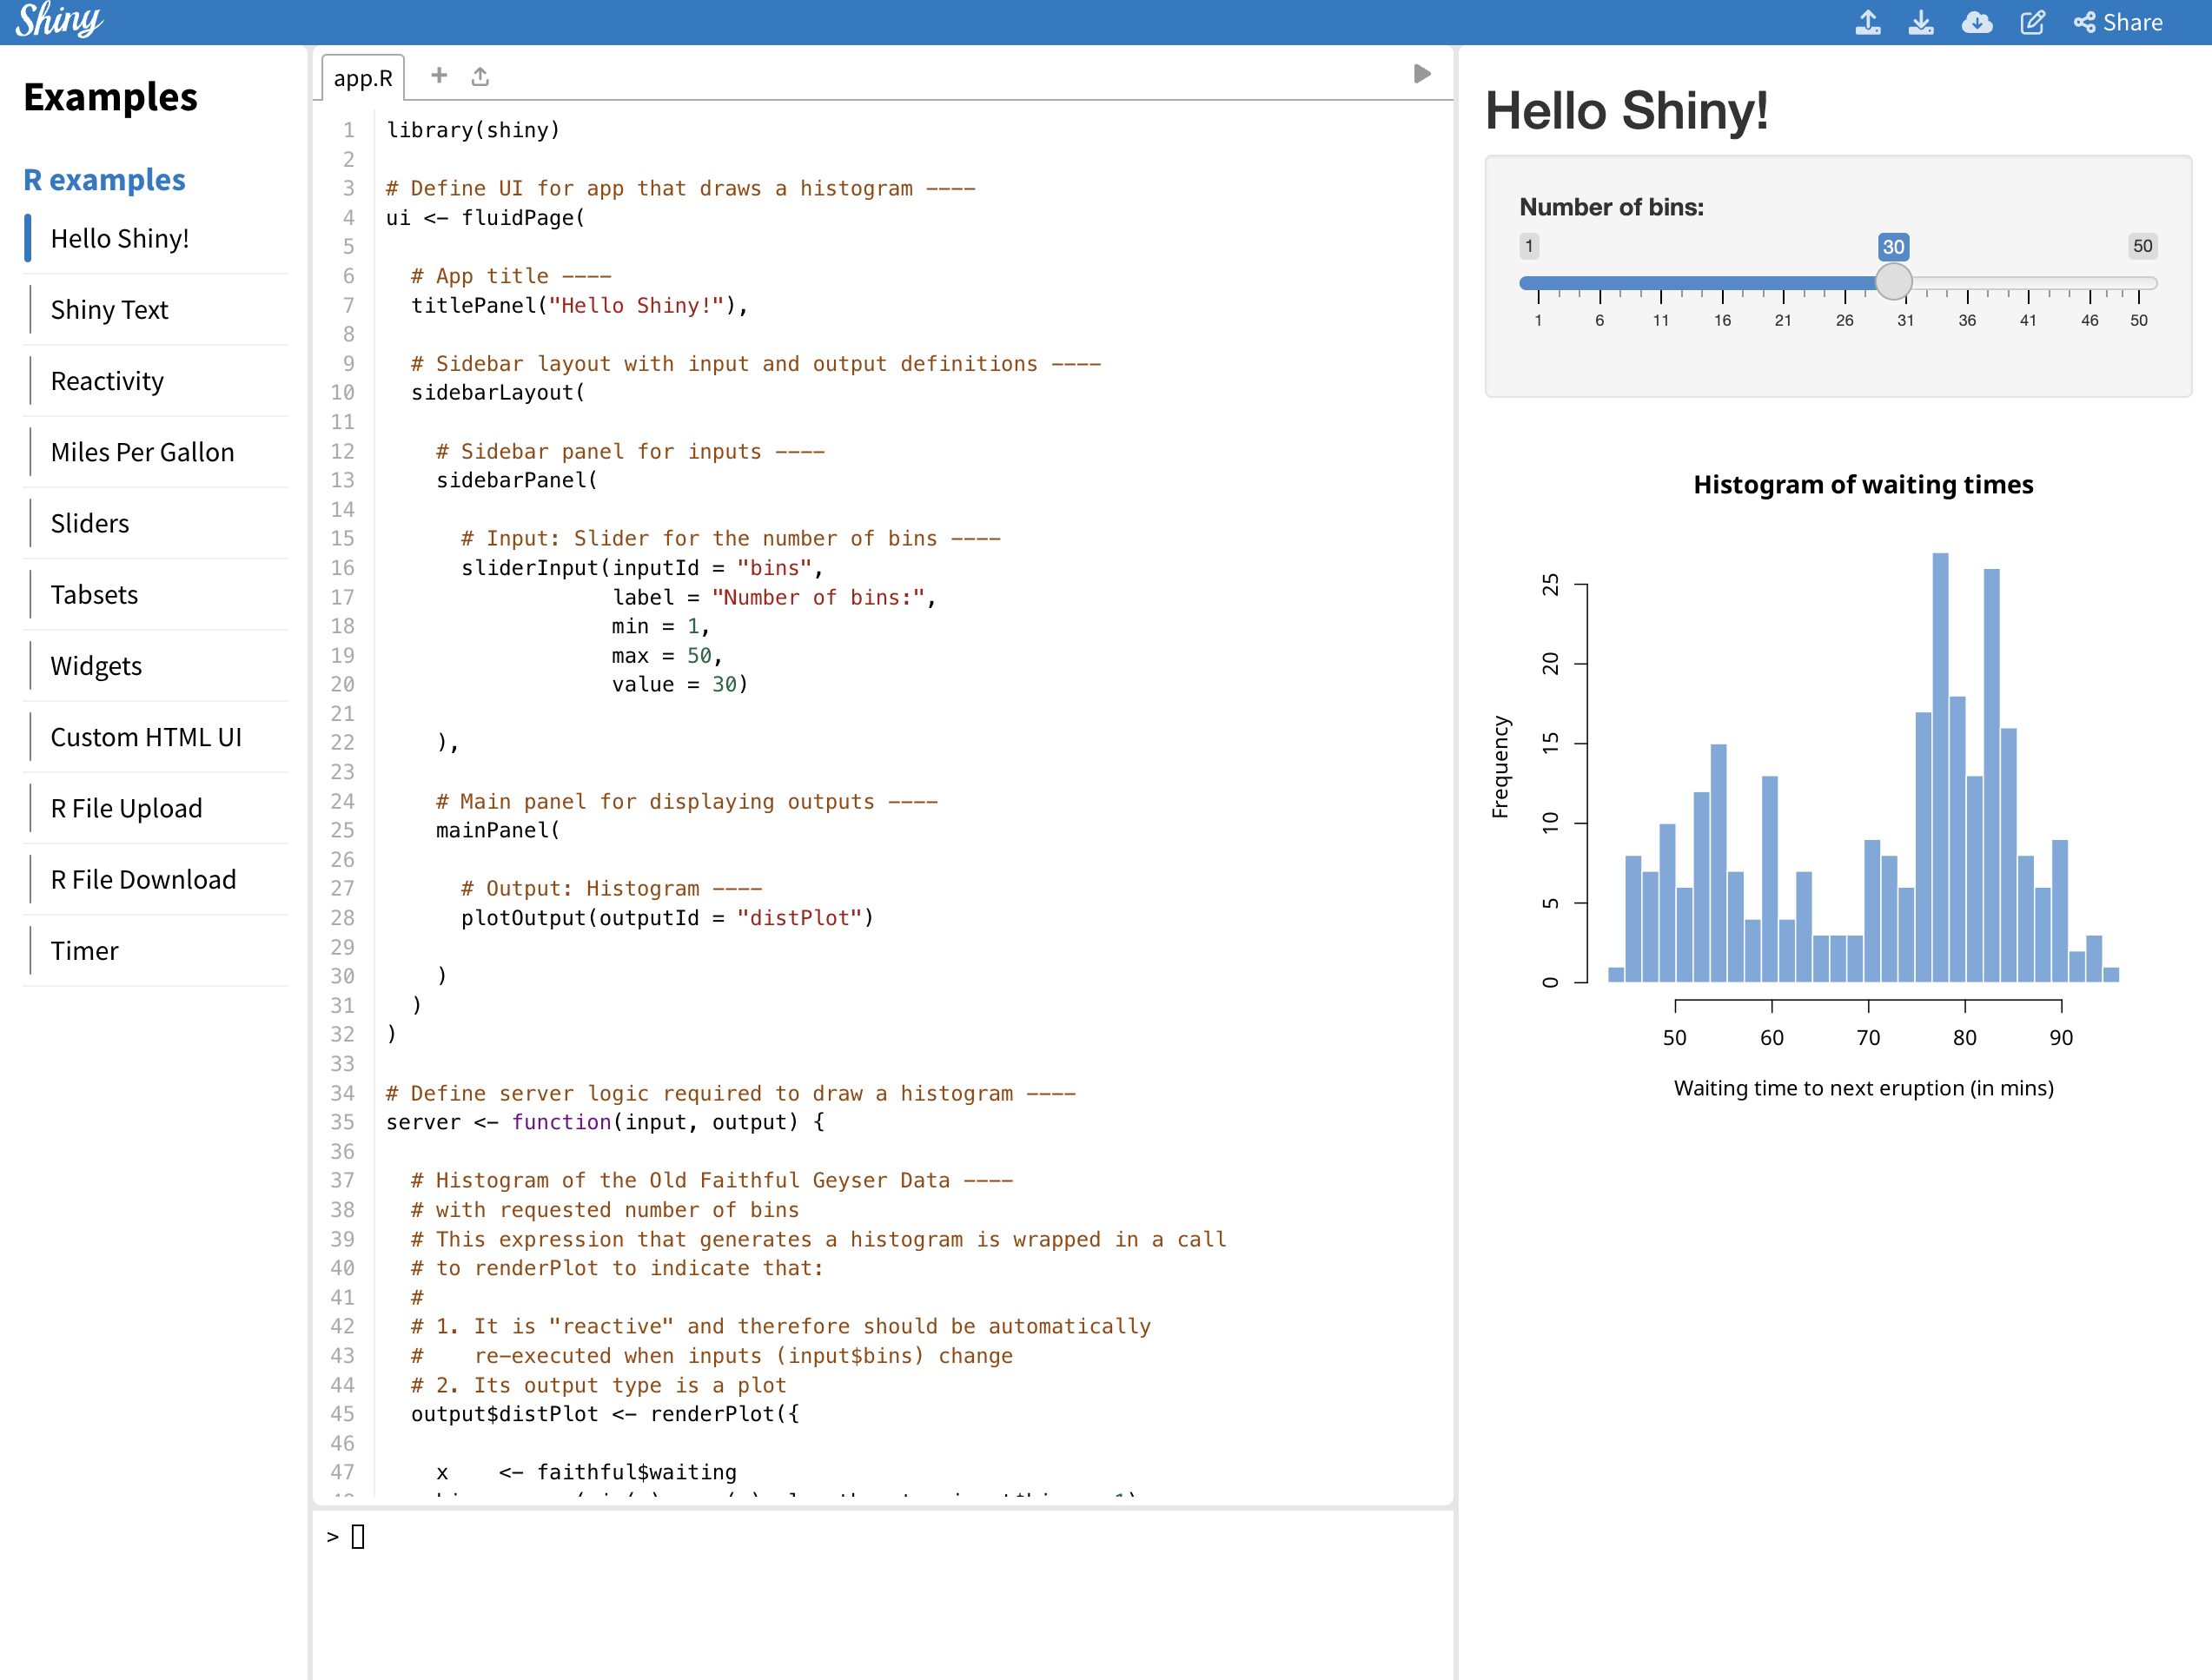
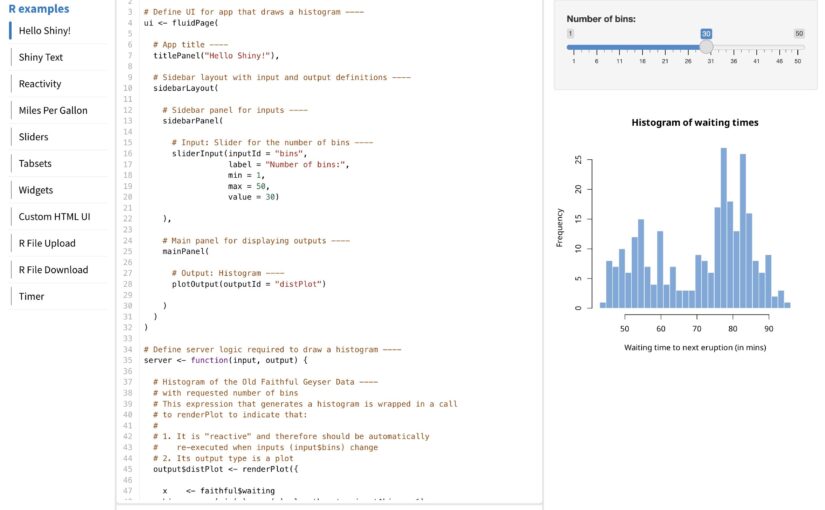
This code creates a simple shiny application that creates a number of histograms in response to the user’s input, as shown below.

There are two ways to create a static page with this code using shinylive, one is to create it as a separate webpage (like previous article) and the other is to embed it as internal content on a quarto blog page .
First, here’s how to create a separate webpage.
shinylive via web page
To serve shiny on a separate static webpage, you’ll need to convert your app.R to a webpage using the shinylive package you installed earlier.
Based on creating a folder named shinylive in my Documents(~/Documents) and saving `app.R` inside it, here’s an example of how the export function would look like
shinylive::export('~/Documents/shinylive', '~/Documents/shinylive_out')
When you run this code, it will create a new folder called shinylive_out in the same location as shinylive, (i.e. in My Documents), and inside it, it will generate the converted wasm version of shiny code using the shinylive package.
If you check the contents of this shinylive_out folder, you can see that it contains the webr, service worker, etc. mentioned in the previous post.

More specifically, the export function is responsible for adding the files from the local PC’s shinylive package assets, i.e. the library files related to shiny, to the out directory on the local PC currently running R studio.

Now, if you create a github page or something based on the contents of this folder, you can serve a static webpage that provides shiny, and you can preview the result with the command below.
httpuv::runStaticServer("~/Documents/shinylive_out")
shinylive in quarto blog
To add a shiny application to a quarto blog, you need to use a separate extension. The quarto extension is a separate package that extends the functionality of quarto, similar to using R packages to add functionality to basic R.
First, we need to add the quarto extension by running the following code in the terminal (not a console) of Rstudio.
quarto add quarto-ext/shinylive
You don’t need to create a separate file to plant shiny in your quarto blog, you can use a code block called {shinylive-r}. Additionally, you need to set shinylive in the yaml of your index.qmd.
filters: - shinylive
Then, in the {shinylive-r} block, write the contents of the app.R we created earlier.
#| standalone: true
#| viewerHeight: 800
library(shiny)

ui <- fluidPage(

titlePanel("Hello Shiny!"),
  sidebarLayout(
  sidebarPanel(
    sliderInput(
      inputId = "bins",
      label = "Number of bins:",
      min = 1,
      max = 50,
      value = 30
    )
  ),
  mainPanel(
    plotOutput(outputId = "distPlot")
    )
  )
)

server <- function(input, output) {
  output$distPlot <- renderPlot({
  x <- faithful$waiting
  bins <- seq(min(x), max(x), length.out = input$bins + 1)
  hist(x,
    breaks = bins, col = "#75AADB", border = "white",
    xlab = "Waiting time to next eruption (in mins)",
    main = "Histogram of waiting times"
  )
  })
}

shinyApp(ui = ui, server = server)
after add this in quarto blog, you may see working shiny application.
You can see working example in this link
Summary
shinylive is a feature that utilizes wasm to run shiny on static pages, such as GitHub pages or quarto blogs, and is available as an R package and quarto extension, respectively.
Of course, since it is less than a year old, not all features are available, and since it uses static pages, there are disadvantages compared to utilizing a separate shiny server.
However, it is very popular for introducing shiny usage and simple statistical analysis, and you can practice it right on the website without installing R, and more features are expected to be added in the future.
The code used in blog (previous example link) can be found at the link.
Author: jhk0530

One thought on “Add shiny in quarto blog with shinylive”