We are enthralled to present to you a tool we have been developing with the R epidemics consortium (RECON) thanks to a grant from the R Consortium: the COVID-19 challenge.
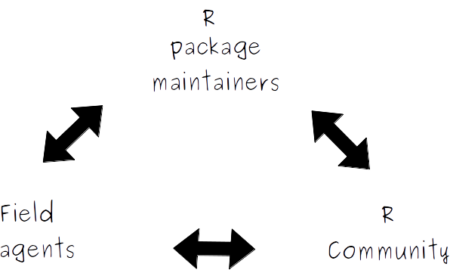
It is an online platform whose general goal is to connect members of the R community, R package developers and field agents working on the response to COVID-19 who use R (such as epidemiologists, statisticians or mathematical modellers) to help them fill-in their R related needs. It provides a single place for field agents to give feedback in real time on their analytical needs (such as requesting specific analysis templates, new functions, new method implementation, etc), these requests are then compiled and organized by order of priority (here) for package developers and (hopefully many!) members of the R community to browse and help contribute to.
Many COVID-19 field agents use R to develop their analysis pipelines, but may lack specific knowledge or time to implement some of their needs. That’s why trying to involve the R community in providing them help could turn out to be very important.
For members of the R community it is not only a great opportunity to contribute to the worldwide response to COVID-19 and provide an application of their skills with direct benefit to the community, but it is also a chance to encourage free, open and citizen science through the development of free and open source professional tools who aim at becoming the new standards in epidemic outbreak response.
These packages have already been successfully used in outbreaks such as the Ebola outbreaks in West Africa (2014-2016) and Eastern Democratic Republic of the Congo (2018-2020), and are currently used by various public health institutions and academic modelling groups in the COVID-19 response.
Although this platform has been developed specifically to contribute to the response to COVID-19 we hope to create a dynamic community that will outlast this epidemic, and become a long term methodological contributor.
If you have any question or suggestion, feel free to write to me at [email protected], we welcome all helpful feedback. Also please communicate this to your local R user group, the more you help us get to circulate the word, the most successful the project will be 🙂
Useful links:
- Link to the platform: tasks.repidemicsconsortium.org/
- Link to the platform’s backend github page: github.com/reconhub/tasks/issues
- Link to RECON: repidemicsconsortium.org/
- Link to more details on the R Consortium grant: https://www.repidemicsconsortium.org/2020-06-09-covid-challenge/