Introduction
{SLmetrics} is a low-level R package designed for efficient performance evaluation in supervised AI/ML tasks. By leveraging {Rcpp} and {RcppEigen}, it ensures fast execution and memory efficiency, making it ideal for handling large-scale datasets. Built on the robust S3 class system, {SLmetrics} integrates seamlessly with stable R packages, ensuring reliability and ease of use for developers and data scientists alike.
Why?
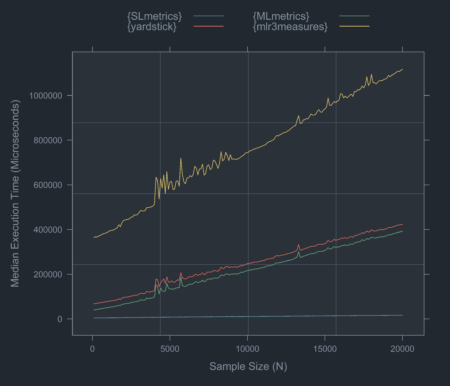
{SLmetrics} combines simplicity with exceptional performance, setting it apart from other packages. While it draws inspiration from {MLmetrics} in its intuitive design, it outpaces it in terms of speed, memory efficiency, and the variety of available performance measures. In terms of features, {SLmetrics} offers functionality comparable to {yardstick} and {scikit-learn}, while being significantly faster.
Current benchmarks show that {SLmetrics} is between 20-70 times faster than {yardstick}, {MLmetrics}, and {mlr3measures} (See Figure 1).

Basic usage of {SLmetrics}
Load {SLmetrics},
library(SLmetrics)# 1) recode Iris
# to binary classification
# problem
iris$species_num <- as.numeric(
iris$Species == "virginica"
)
# 2) fit the logistic
# regression
model <- glm(
formula = species_num ~ Sepal.Length + Sepal.Width,
data = iris,
family = binomial(
link = "logit"
)
)
# 3) generate predicted
# classes
response <- predict(model, type = "response")
# 3.1) generate actual
# classes
actual <- factor(
x = iris$species_num,
levels = c(1,0),
labels = c("Virginica", "Others")
)# 4) generate precision-recall
# curve
roc <- prROC(
actual = actual,
response = response
)# 5) plot by species
plot(roc)
# 5.1) summarise
summary(roc)
#> Reciever Operator Characteristics
#> ================================================================================
#> AUC
#>  - Others: 0.473
#> - Virginica: 0.764# 6) provide custom
# threholds
roc <- prROC(
actual = actual,
response = response,
thresholds = seq(0, 1, length.out = 4)
)# 5) plot by species
plot(roc)
Installing {SLmetrics}
The stable release {SLmetrics} can be installed as follows,
devtools::install_github(
  repo = 'https://github.com/serkor1/SLmetrics@*release',
  ref  = 'main'
)devtools::install_github(
repo = 'https://github.com/serkor1/SLmetrics',
ref = 'development'
)Get involved with {SLmetrics}
We’re building something exciting with {SLmetrics}, and your contributions can make a real impact!
While {SLmetrics} isn’t on CRAN yet—it’s a work in progress striving for excellence—this is your chance to shape its future. We’re thrilled to offer co-authorship for substantial contributions, recognizing your expertise and effort.
Even smaller improvements will earn you a spot on our contributor list, showcasing your valuable role in enhancing {SLmetrics}. Join us in creating a high-quality tool that benefits the entire R community. Check out the repository and start contributing today!