Problem
Image that someone in a bank want to find out whether some of bank’s credit card holders are acctually the same person, so according to his experience, he set a rule: the people share either the same address or the same phone number can be reasonably regarded as the same person. Just as the example:library(tidyverse)
a <- data_frame(id = 1:16,
addr = c("a", "a", "a", "b", "b", "c", "d", "d", "d", "e", "e", "f", "f", "g", "g", "h"),
phone = c(130L, 131L, 132L, 133L, 134L, 132L, 135L, 136L, 137L, 136L, 138L, 138L, 139L, 140L, 141L, 139L),
flag = c(1L, 1L, 1L, 2L, 2L, 1L, 3L, 3L, 3L, 3L, 3L, 3L, 3L, 4L, 4L, 3L))
head(a)
## id addr phone flag
## 1 a 130 1
## 2 a 131 1
## 3 a 132 1
## 4 b 133 2
## 5 b 134 2
## 6 c 132 1
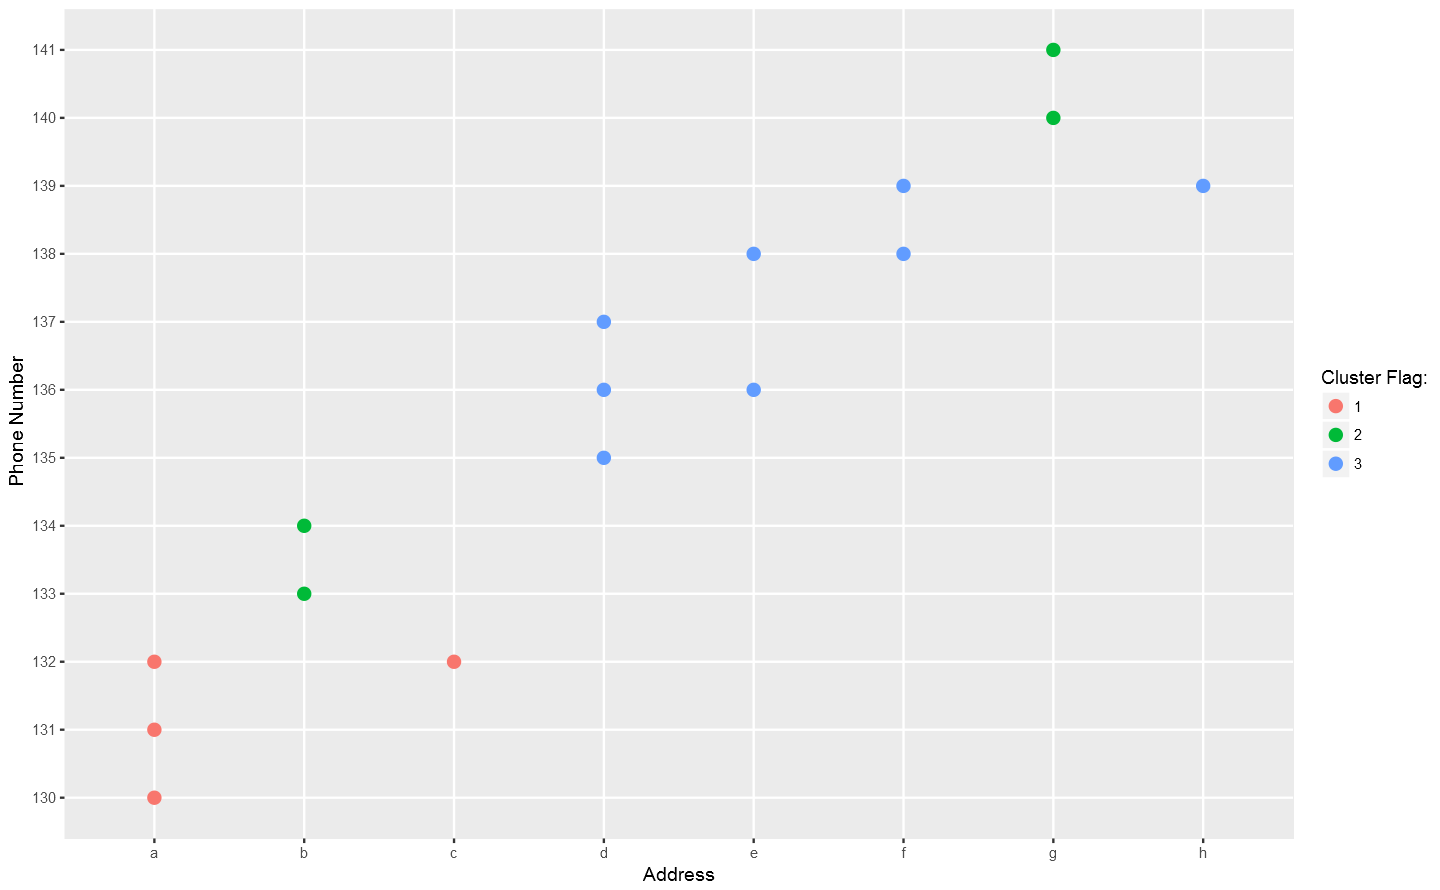
In the dataframe a, the letters in column addr stand for address information, the numbers in column phone stand for phone numbers, and the integers in column flag is what he want: the CLUSTER flag which means "really" different persons.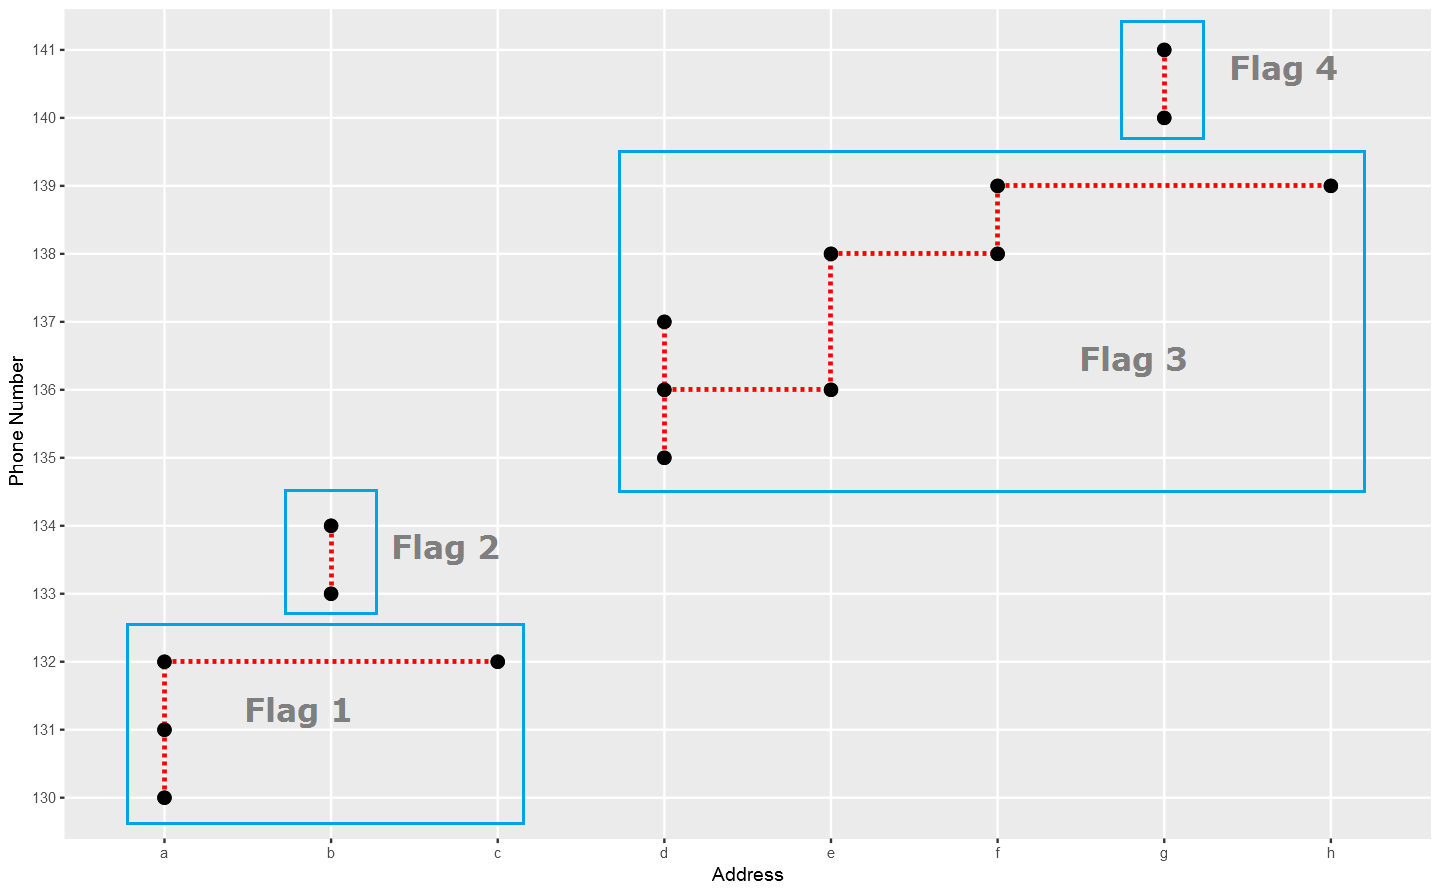 In the above plot, each point stand for a "identity" who has a address which you can tell according to horizontal axis , and a phone number which you can see in vertical axis. The red dotted line present the "connections" betweent identities, which actually means the same address or phone number. So the wanted result is the blue rectangels to circle out different flags which reprent really different persons.
Goal
The "finding the same person" thing is typically a clustring process, and I am very sure there are pretty many ways to do it, Such as Disjoint-set data structure. But, I can not help thinking mayby we can make it in a simple way with R. that's my goal."Dimensional Collapse"
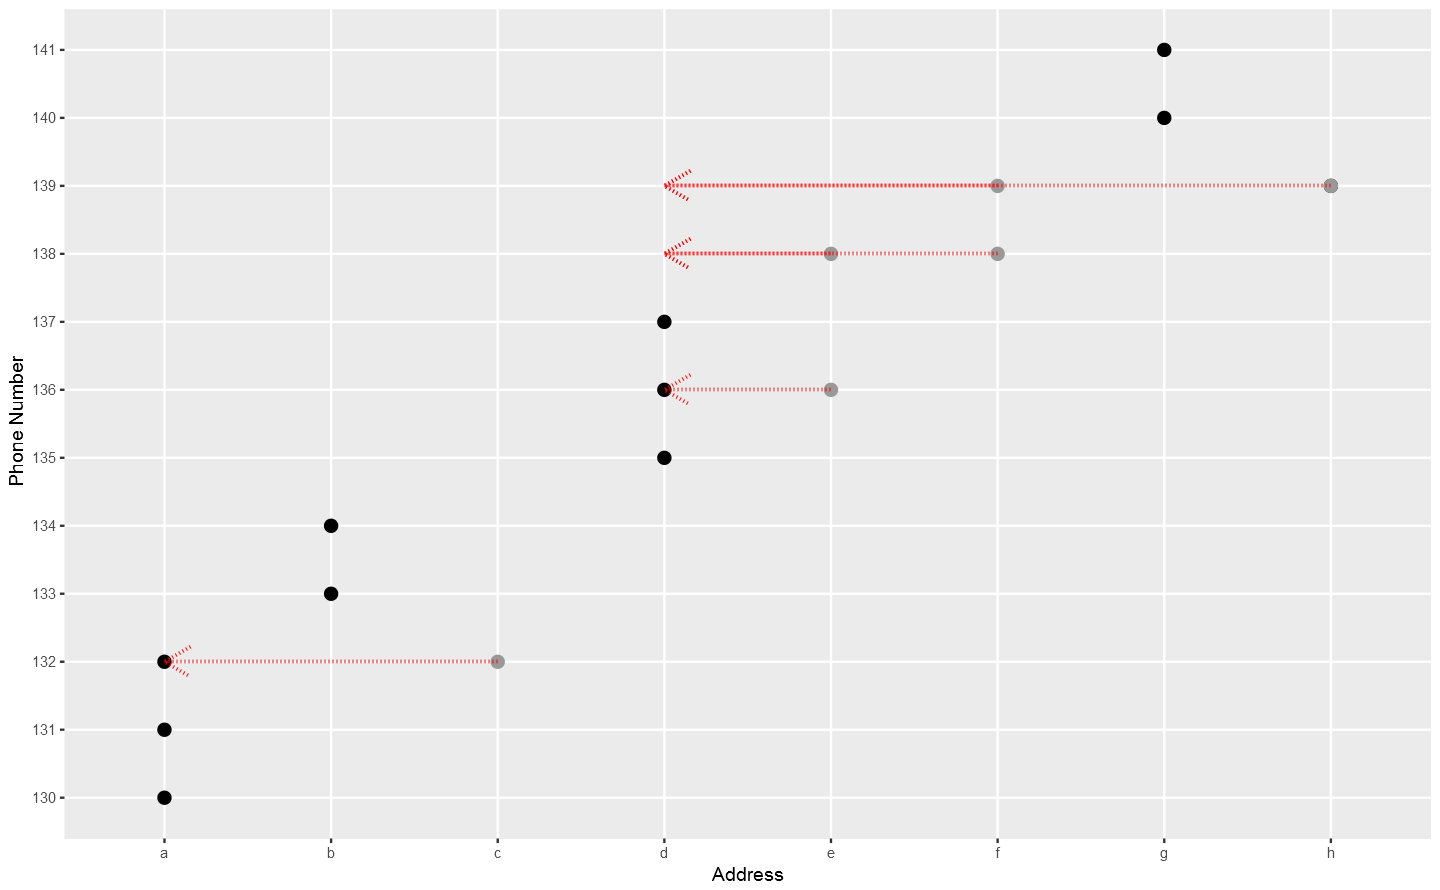
When I stared at the plot, I ask myself, why not map the x-axis information of the points to the very first one according to the y-axis "connections". When everything goes well and all done, all the grey points should be mapped along the red arrows to the first marks of the groups, and there should be only 4 marks leave on x-axis: a, b, d and g, instead of 9 marks in the first place. And the y-axis information, after contributing all the "connection rules", can be put away now, since the left x-axis marks are exactly what I want: the final flags. It is why I like to call it "Dimensional Collapse".Furthermore, in order to take advantage of R properties, I also:
1. Treat both dimensions as integers by factoring them.
2. Use "integer subsetting" to map and collapse.
axis_collapse <- function(df, .x, .y) {
    .x <- enquo(.x)
    .y <- enquo(.y)

    # Turn the address and phone number into integers.
    df <- mutate(df,
                 axis_x = c(factor(!!.x)),
                 axis_y = c(factor(!!.y)))

    oldRule <- seq_len(max(df$axis_x))

    mapRule <- df %>%
      select(axis_x, axis_y) %>%
      group_by(axis_y) %>%
      arrange(axis_x, .by_group = TRUE) %>%
      mutate(collapse = axis_x[1]) %>%
      ungroup() %>%
      select(-axis_y) %>%
      distinct() %>%
      group_by(axis_x) %>%
      arrange(collapse, .by_group = TRUE) %>%
      slice(1) %>%
      ungroup() %>%
      arrange(axis_x) %>%
      pull(collapse)

    # Use integer subsetting to collapse x-axis.
    # In case of indirect "connections", we should do it recursively.
    while (TRUE) {
        newRule <- mapRule[oldRule]
        if(identical(newRule, oldRule)) {
            break
        } else {
            oldRule <- newRule
        }
    }

    df <- df %>%
      mutate(flag = newRule[axis_x],
             flag = c(factor(flag))) %>%
      select(-starts_with("axis_"))

    df
}
Let see the result.a %>% rename(flag_t = flag) %>% axis_collapse(addr, phone) %>% mutate_at(.vars = vars(addr:flag), factor) %>% ggplot(aes(factor(addr), factor(phone), shape = flag_t, color = flag)) + geom_point(size = 3) + labs(x = "Address", y = "Phone Number", shape = "Target Flag:", color = "Cluster Flag:")
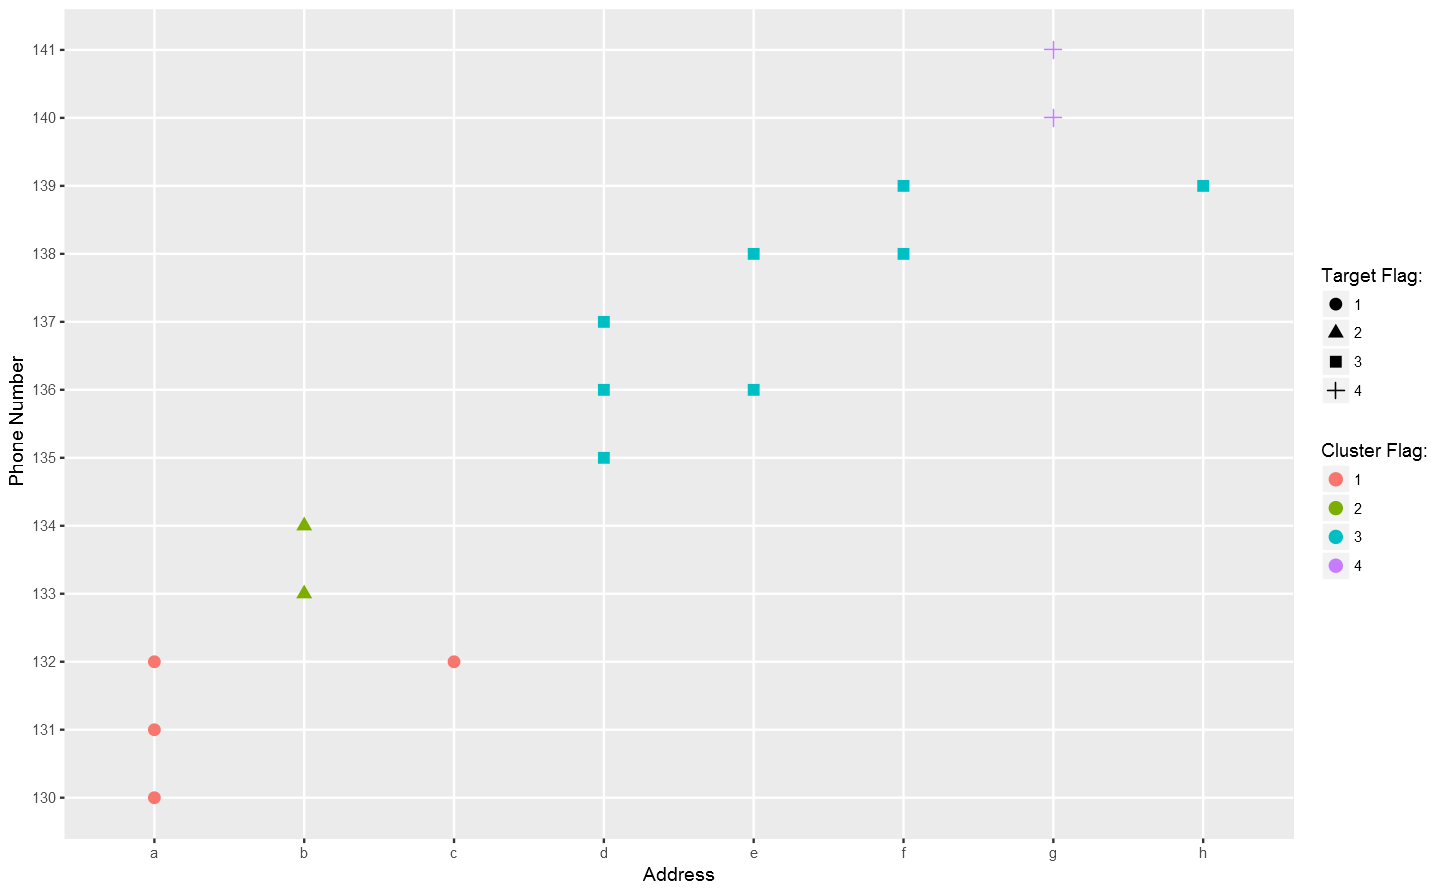 Not bad so far.
Calculation Complexity
Let make a simple test about time complexity.test1 <- data_frame(addr = sample(1:1e4, 1e4), phone = sample(1:1e4, 1e4))
test2 <- data_frame(addr = sample(1:1e5, 1e5), phone = sample(1:1e5, 1e5))
bm <- microbenchmark::microbenchmark(n10k = axis_collapse(test1, addr, phone),
n100k = axis_collapse(test2, addr, phone),
times = 30)
summary(bm)
## expr min lq mean median uq max neval cld
## n10k 249.2172 259.918 277.0333 266.9297 279.505 379.4292 30 a
## n100k 2489.1834 2581.731 2640.9394 2624.5741 2723.390 2839.5180 30 b
It seems that the growth of consumed time is in linear relationship with data increase holding the other conditions unchanged. That is acceptable.More Dimensions?
To me, since this method collapse one dimension by transfering their clustering information to the other dimension, so the method should can be used resursively on more than 2 dimensions. But I am not 100% sure. Let do a simple test.a %>% # I deliberately add a column which connect group 2 and 4 only. mutate(other = c(LETTERS[1:14], "D", "O")) %>% # use axis_collapse recursively axis_collapse(other, phone) %>% axis_collapse(flag, addr) %>% ggplot(aes(x = factor(addr), y = factor(phone), color = factor(flag))) + geom_point(size = 3) + labs(x = "Address", y = "Phone Number", color = "Cluster Flag:")