The main purpose of the package ExpDes is to analyze simple experiments under completely randomized designs (crd()), randomized block designs (cbd()) and Latin square designs (latsd()). Also enables the analysis of treatments in a factorial design with 2 and 3 factors (fat2.crd(), fat3.crd(), fat2.rbd(), fat3.rbd()) and also the analysis of split-plot designs (split2.crd(), split2.rbd()). Other functionality is analyzing experiments with one additional treatments on completely randomized design and randomized blocks design with 2 or 3 factors (fat2.ad.crd(), fat2.ad.rbd(), fat3.ad.crd() and fat3.ad.crd()).
After loading the package and reading and attaching the data, a single command is required to analyze any situation. For instance, consider a completely randomized design for a qualitative factor.
crd(treat, resp, quali = TRUE, mcomp = "tukey")
crd(trat, resp, quali = FALSE, sigF = 0.05)
---------------------------------------------------------------
Analysis of Variance Table
---------------------------------------------------------------
            DF      SS      MS      Fc      Pr>Fc
Treatament  3   214.88  71.626  6.5212  0.0029622
Residuals   20  219.67  10.984
Total       23  434.55
---------------------------------------------------------------
CV = 3.41 %

---------------------------------------------------------------
Shapiro-Wilk normality test
p-value:  0.91697
According to Shapiro-Wilk normality test at 5% of significance,
residuals can be considered normal.
---------------------------------------------------------------

---------------------------------------------------------------
Homogeneity of variances test
p-value:  0.1863216
According to the test of bartlett at 5% of significance,
residuals can be considered homocedastic.
---------------------------------------------------------------

Tukey's test
---------------------------------------------------------------
Groups  Treatments  Means
  a            A    102.1983
   b           B    96.74333
   b           C    95.05833
   b           D    94.74333
---------------------------------------------------------------
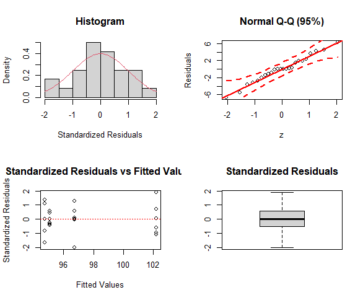
 a <- crd(treat, resp)
 plotres(a)
[contact-form][contact-field label=”Name” type=”name” required=”true” /][contact-field label=”Email” type=”email” required=”true” /][contact-field label=”Website” type=”url” /][contact-field label=”Message” type=”textarea” /][/contact-form]