By Beth Milhollin (
[email protected]), Russell Zaretzki (
[email protected]), and Audris Mockus (
[email protected])
Coke and Pepsi have been fighting the cola wars for over one hundred years and, by now, if you are still willing to consume soft drinks, you are either a Coke person or a Pepsi person. How did you choose? Why are you so convinced and passionate about the choice? Which side is winning and why? Similarly, some users of R prefer enhancements to data frame provided by data.table while others lean towards tidy-related framework. Both popular R packages provide functionality that is lacking in the built-in R data frame. While the competition between them spans much less than one hundred years, can we draw similarities and learn from the deeper understanding of consumption choices exhibited in Coke vs Pepsi battle? One of the basic measures of consumer enthusiasm is a so-called Net Promoter Score (NPS).
In the business world, the NPS is widely used for products and services and it can be a leading indicator for market share growth. One simple question is the basis for the NPS – How likely are you to recommend the brand to your friends or colleagues, using a scale from 0 to 10? Respondents who give a score of 0-6 belong to the Detractors group. These unhappy customers will tend to voice their displeasure and can damage a brand. The Passive group gives a score of 7-8, and they are generally satisfied, but they are also open to changing brands. The Promoters are the loyal enthusiasts who give a score of 9-10, and these coveted cheerleaders will fuel the growth of a brand. To calculate the NPS, subtract the percentage of Detractors from the percentage of Promoters. A minimum score of -100 means everyone is a Detractor, and the elusive maximum score of +100 means everyone is a Promoter.
How does the NPS play out in the cola wars? For 2019 there is a standoff, with Coca-cola and Pepsi tied at 20. Instinct tells us that a NPS over 0 is good, but how good? The industry average for fast moving consumer goods is 30 (“Pepsi Net Promoter Score 2019 Benchmarks”, 2019). We will let you be the judge.
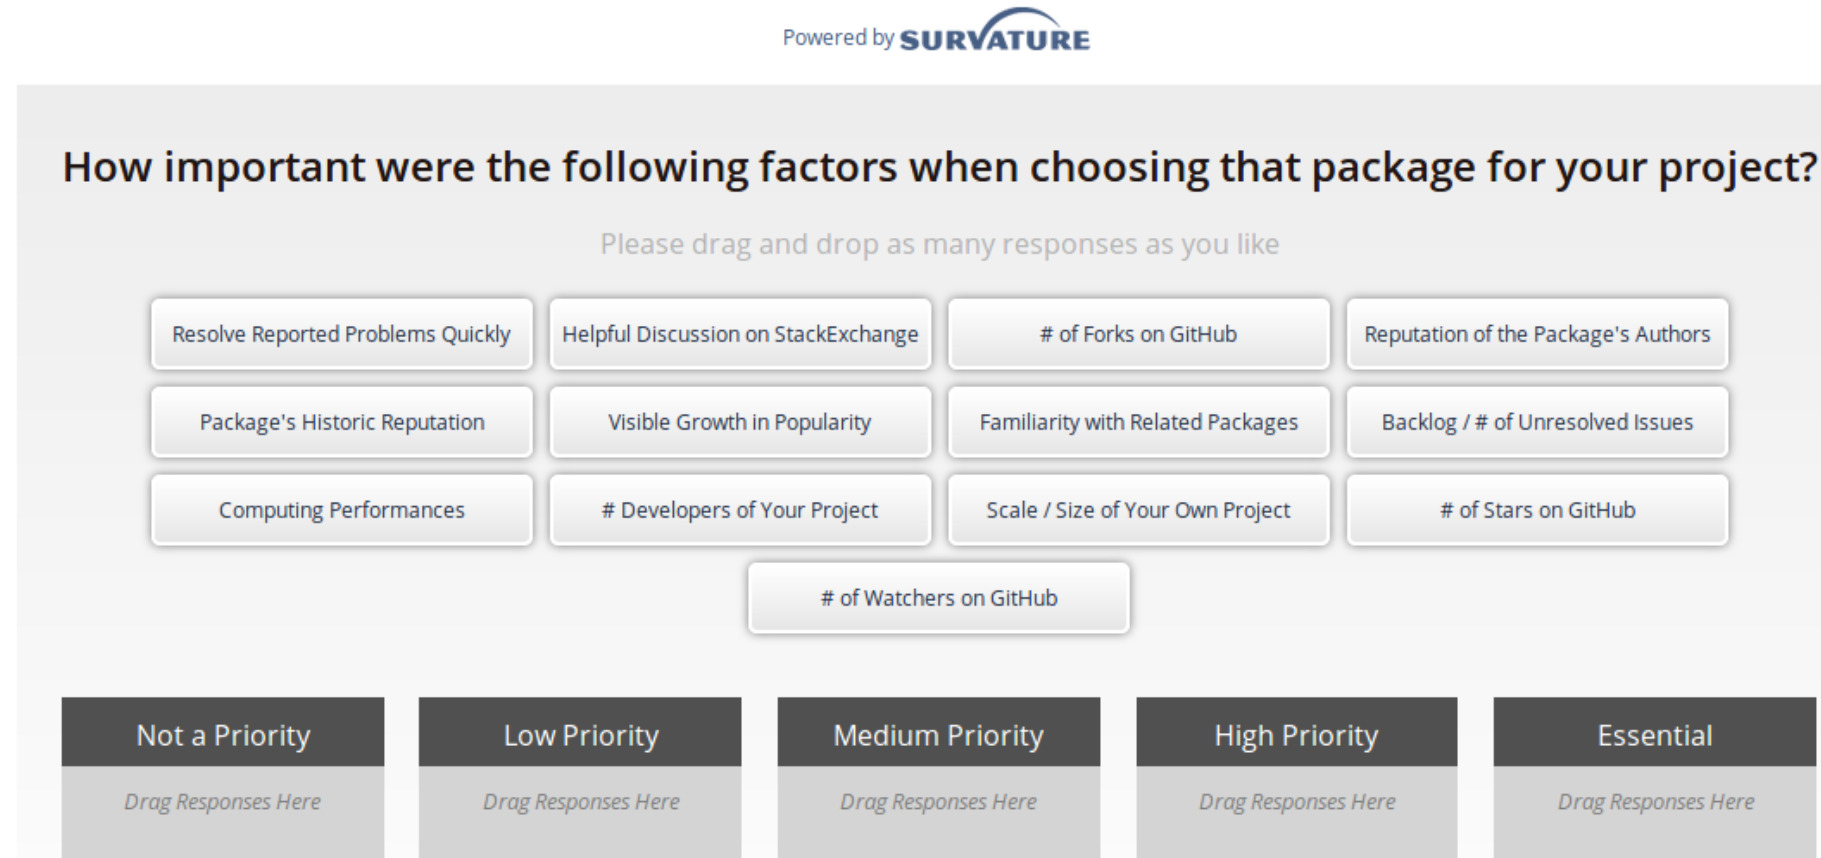
In the Fall of 2018 we surveyed R users
identified by the first commit that added a dependency on either package to a public repository (a repository hosted on GitHub, BitBucket, and other so-called software forges) with some code written in R language. The results of the full survey can be seen
here. The responding project contributors were identified as “data.table” users or “tidy” users by their inclusion of the corresponding R libraries in their projects. The survey responses were used to obtain a Net Promoter Score.

Unlike the cola wars, the results of the survey indicate that data.table has an industry average NPS of 28.6, while tidy brings home the gold with a 59.4. What makes tidy users so much more enthusiastic in their choice of data structure library? Tune in for next installment where we try to track down what factors drive a users choice.
 References
: “Pepsi Net Promoter Score 2019 Benchmarks.” Pepsi Net Promoter Score 2019 Benchmarks | Customer.guru, customer.guru/net-promoter-score/pepsi.