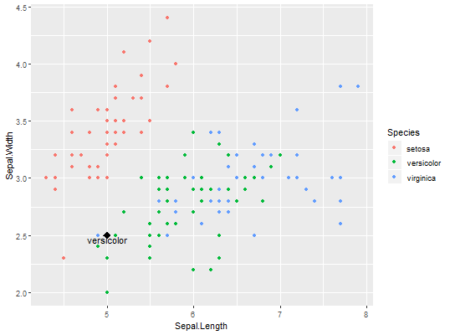
K-nearest neighbors is easy to understand supervised learning method which is often used to solve classification problems. The algorithm assumes that similar objects are closer to each other.

To understand it better and keeping it simple, explore this shiny app, where user can define data point, no. of neighbors and predict the outcome. Data used here is popular Iris dataset and ggplot2 is used for visualizing existing data and user defined data point. Scatter-plot and table are updated for each new observation.
Data is more interesting in overlapping region between versicolor and virginica. Especially at K=2 error is more vivid, as same data point is classified into different categories. In the overlapping region, if there is a tie between different categories outcome is decided randomly.
One can also see accuracy with 95% Confidence Interval for different values K neighbors with 80/20 training-validation data . While classification is done with ‘class’ package, accuracy is calculated with ‘caret’ library.