This is an analysis inspired by Dan’s 2014 article and it’s meant to be a continuation of his idea with a larger sample size and a slightly different approach.
I’ve used the PRAW package in Python to scrape data from the progresspics subbredit, and I ran the data analysis in R. I was able to collect data from 77 individuals and I chose to split the entire analysis by gender – due to the differences in abdominal fat distribution between men and women.

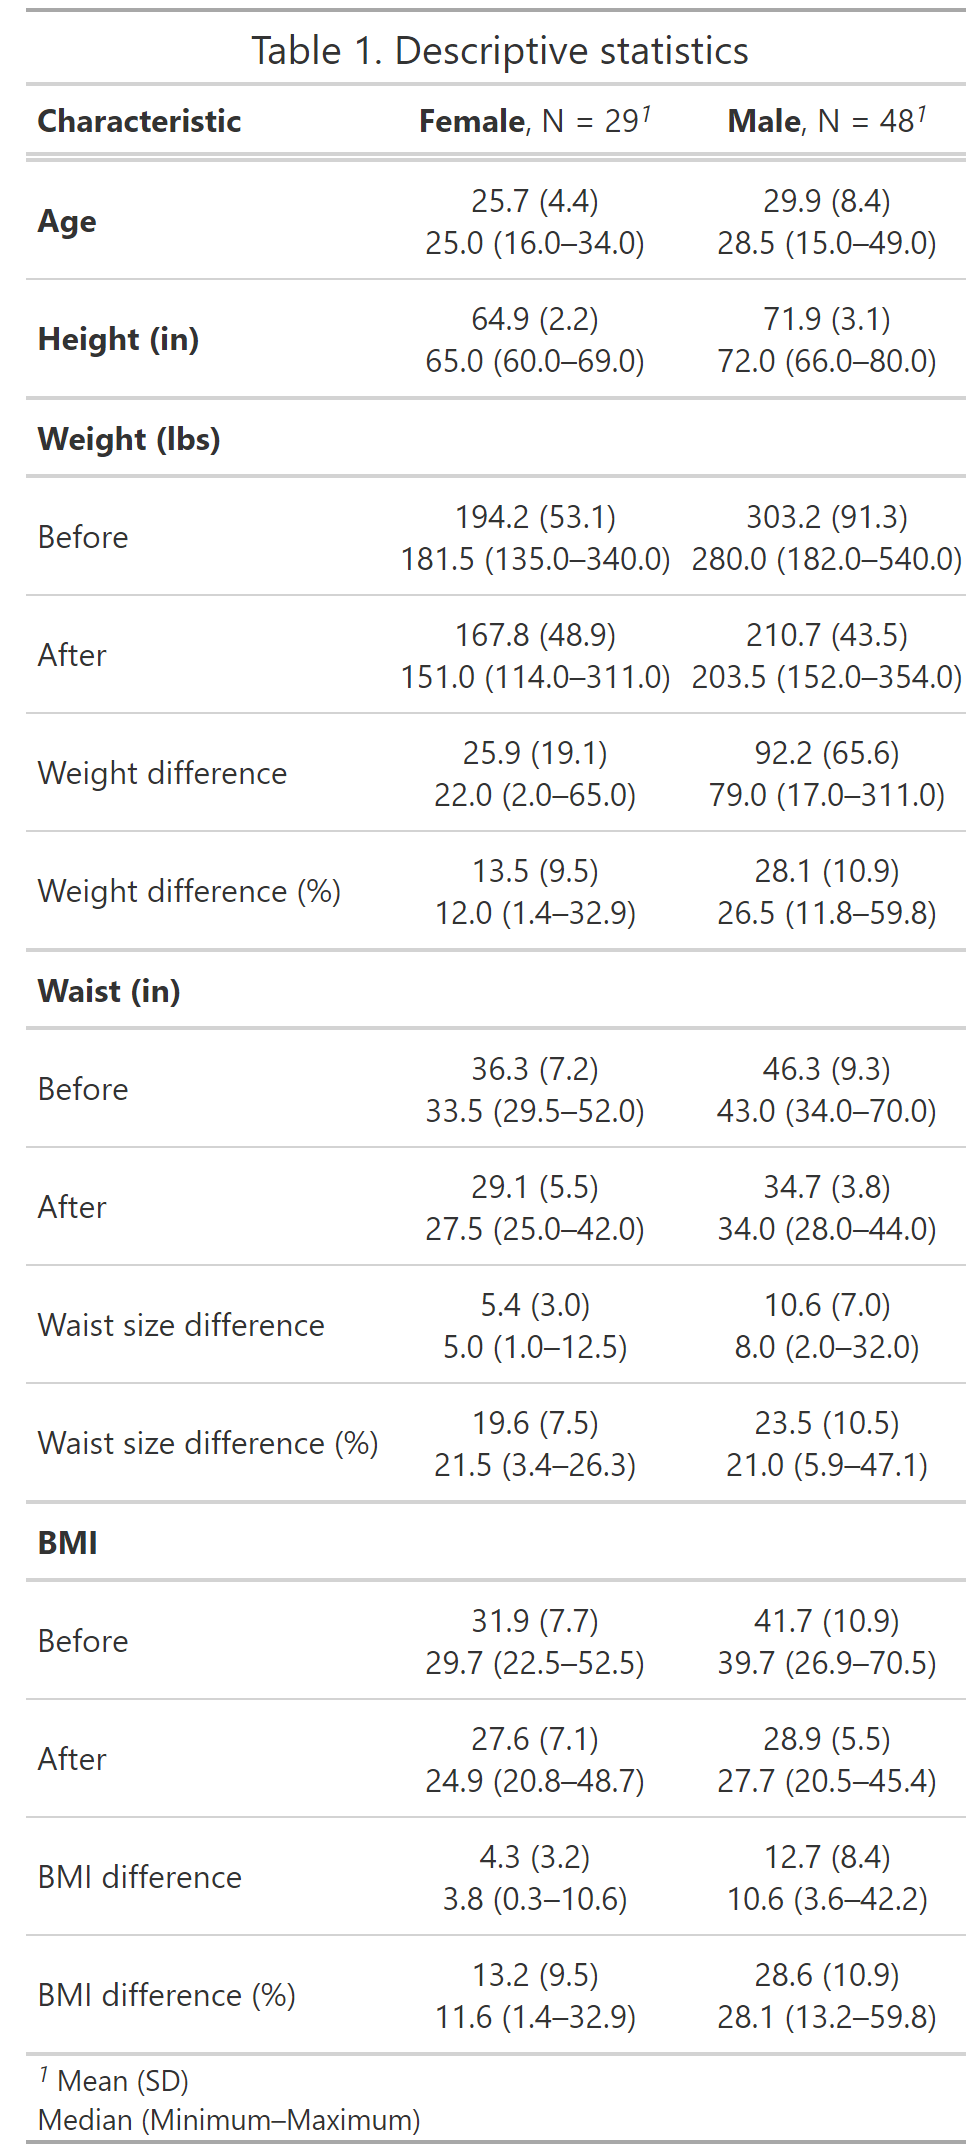
As can be observed from Table 1 and the plot, weight loss tends to be much higher for the males than for the females – both in absolute units and percentage-wise.
 I chose to run four different regression models, for each gender. While Dan’s article only considered weight change, I also included the weight percentage change, BMI change, and BMI percentage change.
# Male
lm(weightDiff ~ waistDiff, data, subset = gender == "Male")
lm(weightDiff_perc ~ waistDiff, data, subset = gender == "Male")
lm(bmiDiff ~ waistDiff, data, subset = gender == "Male")
lm(bmiDiff_perc ~ waistDiff, data, subset = gender == "Male")

# Female
lm(weightDiff ~ waistDiff, data, subset = gender == "Female")
lm(weightDiff_perc ~ waistDiff, data, subset = gender == "Female")
lm(bmiDiff ~ waistDiff, data, subset = gender == "Female")
lm(bmiDiff_perc ~ waistDiff, data, subset = gender == "Female")

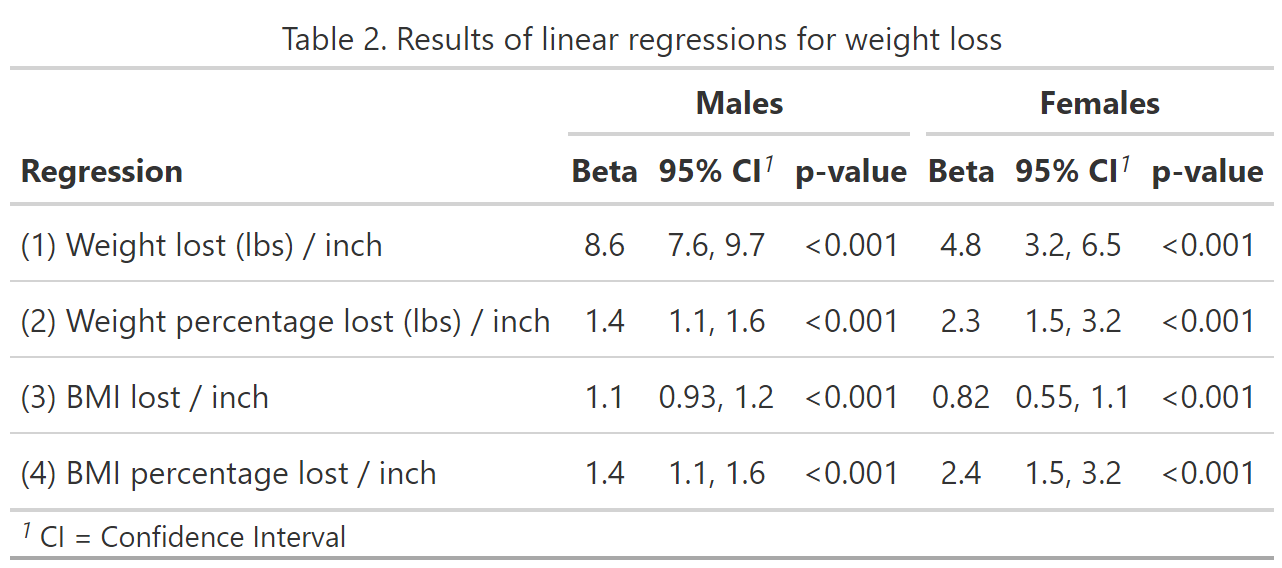
Based on the results from Table 2, we could conclude the following:
Males
- On average, you need to lose 8.6 lbs (3.9 kg) to lose 1 inch off the waist.
- On average, you need to lose 1.4% of your weight to lose 1 inch off the waist.
- On average, you need to lose 1.1 BMI points to lose 1 inch off the waist.
- On average, you need to reduce your BMI by 1.4% to lose 1 inch off the waist.
- On average, you need to lose 4.8 lbs (2.1 kg) to lose 1 inch off the waist.
- On average, you need to lose 2.3% of your weight to lose 1 inch off the waist.
- On average, you need to lose 0.82 BMI points to lose 1 inch off the waist.
- On average, you need to reduce your BMI by 2.4% to lose 1 inch off the waist.
If you want to delve deeper, you can find the data and the code I used here.
Hi my friend, any source code on how to do the scarpping?
Also 77 were the “clean” results or just an arbitrary number?
Hi,
I added the code used for scraping.
I was left with 77 individuals after getting rid of those that weren’t eligible.
Best,
Emanuel
The topic and the methods are both interesting. As much as the code for statistical modeling is appreciated, a pointer to your ggplot2 code (presuming that’s where your figure came from) would also be appreciated. As would the code for your table, if directly created in R.
Hi,
As mentioned in the last sentence of my article, you can find all the code used to generate the tables and the figure here. I didn’t add it to the article because it is rather long.
Best,
Emanuel
A belated thank you!