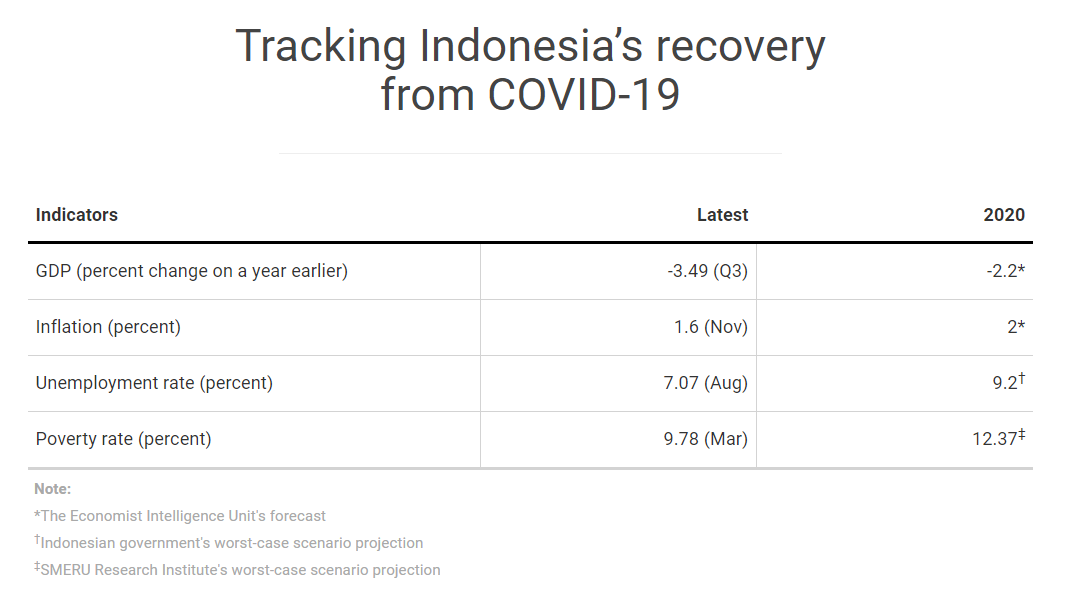
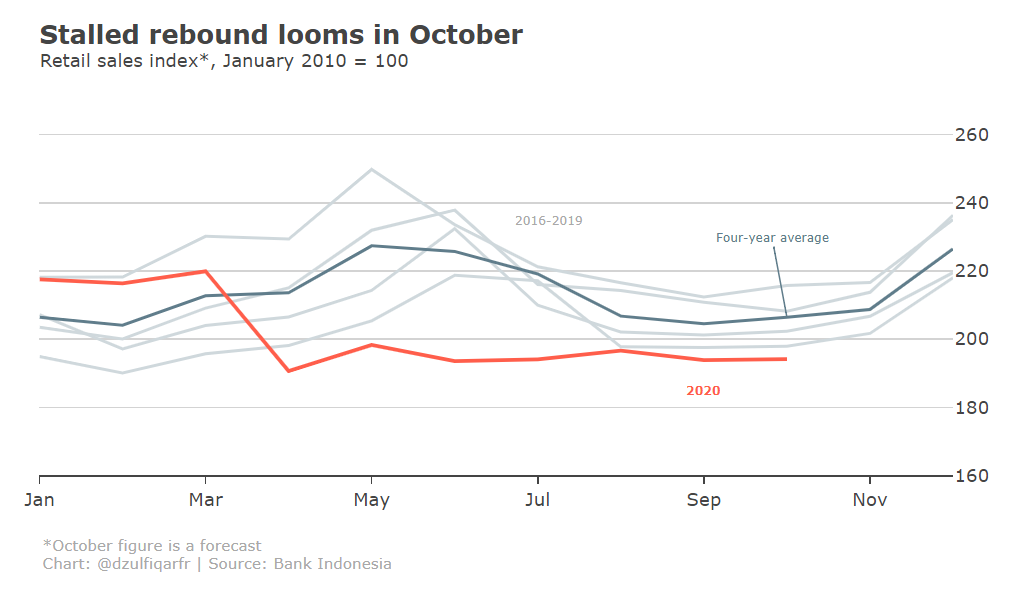
But the lack of single platform providing the necessary data in Indonesia poses a challenge to do just that. The relevant data, such as consumer confidence and confirmed cases and deaths, are publicly accessible but are scattered across several websites.
Using R, I developed in early November a website that I hope can overcome that challenge. By aggregating the data on one platform, the website seeks to serve as a sort of recovery tracker for not only the economy but also the public health.
You can visit the tracker at https://dzulfiqarfr.github.io/indonesia-recovery-tracker/

I use R Markdown to build the website. To create the interactive graphs, I use Plotly through the plotly package. I also use the gt package to create the tables on the website.
The indicators are as follow:
- Gross domestic product (GDP);
- Inflation;
- Unemployment rate;
- Poverty rate;
- Consumer confidence;
- Retail sales;
- Movement trends;
- Confirmed cases and deaths; and
- Coronavirus tests

The website does not cover all available economic and public health indicators, but I try to make sure it has timely and relevant data to see how the country is doing as the pandemic unfolds.
I may add another indicator to the website in the future, if necessary.
The website is still far from perfect. So if you have any suggestions or find a bug, please let me know!