Gaussian Simulation of Spatial Data Using R
Richard E. Plant This post is a condensed version of an Additional Topic to accompany Spatial Data Analysis in Ecology and Agriculture using R, Second Edition. The full version together with the data and R code can be found in the Additional Topics section of the book’s website, http://psfaculty.plantsciences.ucdavis.edu/plant/sda2.htm Chapter and section references are contained in that text, which is referred to as SDA2.1. Introduction
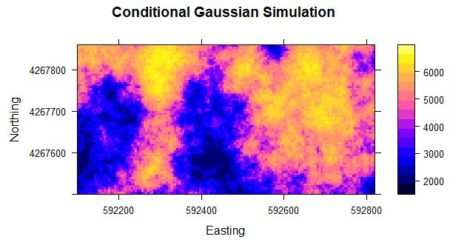
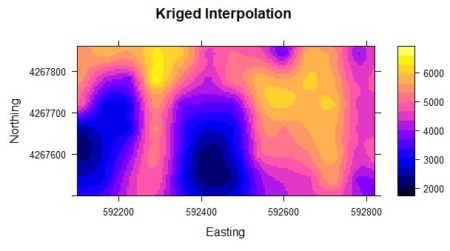
Probably the most common task in spatial data analysis is to estimate the values of some quantity at locations other than those at which it was measured. Beginning GIS classes often emphasize the use of spatial interpolation methods such as inverse distance weighting and kriging to carry out this task, and these are indeed important tools. They are not the whole story, however, and for some applications they may actually give results that lead to incorrect conclusions. A common alternative to interpolation is a method called conditional simulation. The purpose of this post is to describe conditional simulation, in particular conditional Gaussian simulation, to compare it with interpolation, and to show how to program it in R. We will also touch on the related topic of unconditional Gaussian simulation and see how the two differ. To demonstrate conditional simulation we need a data set that is densely defined in space so that we may sample from it, use the sample data to predict population values at unsampled points, and compare these predicted values with the true data values. The yield monitor data associated with Data Set 4 of SDA2 are very suitable for this purpose. In particular, we will use the wheat yield data of Field 2. A cleaned version of this data set was developed in Section 6.3.2 of SDA2, and this was converted to a regular grid. Fig. 1 shows the full gridded data set. The grid has 144 cells in the east-west direction and 72 cells in the north-south direction. Also shown in the figure are the 78 points at which field sample data were collected. The locations of these points in the grid were set to the closest grid cell to each sample point. Here is a part of the code showing the names of the R data objects and the assignment of sample point locations. > data.Set4.2 <- read.csv(“set4\\set4.296sample.csv”, header = TRUE)> Y.full.data.sf <- st_read(“Created\\Set42pop.shp”)
> Y.full.data.sp <- as(Y.full.data.sf, “Spatial”)
> gridded(Y.full.data.sp) <- TRUE
> proj4string(Y.full.data.sp) <- CRS(“+proj=utm +zone=10
+ellps=WGS84″)
> sample.coords <- cbind(data.Set4.2$Easting, data.Set4.2$Northing)
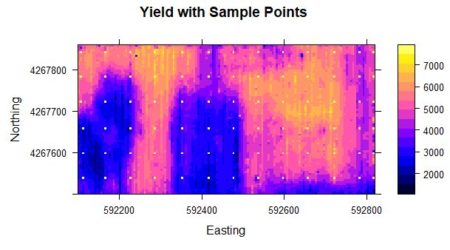 Figure 1. Yield population data. The sample points are shown as bright yellow pixels.
As was discussed in SDA2, the areas in the western half of the field with very low yield were the result of a failed herbicide application due to equipment malfunction. We will use the sample points to extract from the full grid the data values that will be used to develop our kriging interpolations and conditional simulations. We will also need the record numbers of the sample points.
> closest.point <- function(sample.pt, grid.data){
+ dist.sq <- (coordinates(grid.data)[,1]-sample.pt[1])^2 +
+ (coordinates(grid.data)[,2]-sample.pt[2])^2
+ return(which.min(dist.sq))
+ }
> samp.pts <- apply(sample.coords, 1, closest.point,
+ grid.data = Y.full.data.sp)
> data.Set4.2$ptno <- samp.pts
> data.Set4.2$Yield <- Y.full.data.sp$Yield[samp.pts] The kriging analysis is similar, but not identical, to the analysis carried out in Sec. 6.3.2 of SDA2. > # Convert data.Set4.2 to a Spatial Points Data Frame
> # This is needed for the function krige()
> data.Set4.2.sp <- data.Set4.2
> coordinates(data.Set4.2.sp) <- c(“Easting”, “Northing”)
> proj4string(data.Set4.2.sp) <- CRS(“+proj=utm +zone=10
+ +ellps=WGS84″)
> # Kriging
> data.var <- variogram(object = Yield ~ 1, locations =
+ data.Set4.2.sp, cutoff = 600)
> data.fit <- fit.variogram(object = data.var, model =
+ vgm(150000, “Sph”, 250, 1))
> Yield.krige <- krige(formula = Yield ~ 1,
+ locations = data.Set4.2.sp, newdata = Y.full.data.sp,
+ model = data.fit)
|
|
|
|
(1) |
+ n.heads <- rbinom(1,n.tosses,p)
+ } The function takes two arguments, the number of tosses n.tosses and the probability of heads p. The simulation is then carried out as follows.
> set.seed(123)
> n.tosses <- 20
> p <- 0.5
> n.reps <- 10000
> U <- replicate(n.reps, coin.toss(n.tosses, p))
> mean(U)
[1] 9.9814
> var(U)
[1] 4.905345 The mean and variance of U are close to their theoretically predicted values of 10 and 5, respectively.
In this post we will only discuss a specific kind of conditional simulation, called conditional Gaussian simulation. As the name implies, the value of the quantity being simulated is assumed to follow a normal (i.e., Gaussian) distribution. We will see that this greatly improves the analysis. Zanon and Leuangthong (2004) give a nice outline of the steps involved in conditional Gaussian simulation. They are as follows.
1. If the data are not normally distributed, transform them into a distribution that is to the greatest extent possible normal.
2. Generate a random sequence of steps that encounters each data value once.
3. At each step sequentially,
a. search to find nearby sample data and previously simulated values,
b. calculate the conditional distribution based on these data, and
c. perform Monte Carlo simulation to obtain a single value from the
distribution.
4. Repeat Step 3 until every data location has been visited.
5. If necessary, back transform the simulated data to the original distribution. As with neural networks in the Additional Topic on that technology, probably the best way to gain understanding of conditional Gaussian simulation is to construct a conditional Gaussian simulation algorithm that carries out the process in a similar way to the R function used to construct the simulation shown in Fig. 2b. To do this we must first review some important aspects of geostatistics (Section 2). In Section 3 we will construct the simple conditional Gaussian simulation algorithm, and in Section 4 we will describe the use of R gstat library (Pebesma, 2003, 2004) functions to carry out conditional and unconditional Gaussian simulation.
2. Geostatistics Review
a. Variance and covarianceLet Y(x) represent the quantity of interest measured at n locations xi, i =1,…,n, where xi is a two dimensional position vector. It is traditional in statistics to use this subscript notation, whereas in geostatistics it is traditional to use a notation involving the spatial lag, and we will switch to that in a moment. The key step in the conditional simulation algorithm described in the previous section is Step 3b, computing the probability distribution of the process Y(x) at the current location x conditional on the values of Y at nearby already sampled or simulated locations. To do this we must be able to compute the covariance between Y values at these locations, and this is done using the variogram. Much of the material that we will be going over in Subsection a is contained in SDA2 Sections 4.6.1 and 6.3.2, but it is convenient to repeat it in greater detail. Let the lag distance h be the distance between two points in the region. Assume that the region is stationary and isotropic (see SDA2, Sec. 3.2.2), so that h only depends on the magnitude of the distance and not its direction or the location of the points in the region. The derivation of the relationship between the covariance and the variogram follows an argument similar to that used in the Additional Topic on Spatial Sampling. The covariance between Y(x) and Y(x+h) is defined as
|
C(h) = Cov{Y(x),Y(x+h)}. |
(2) |
| (3) |
|
|
(4) |
b. Simple kriging
The interpolation exercise carried out in Section 1 involved ordinary kriging. The difference between simple kriging and ordinary kriging is that in simple kriging the value of the mean μ of the distribution is assumed to be known, whereas in ordinary kriging it is not. In the most common interpolation applications, the mean is obviously not known, and so ordinary kriging is the more widely used of the two. We will see, however, that simple kriging can be employed in conditional simulation, and so we will develop it here. Since the mean μ is known, we can define a new variable
|
Z(x) = Y(x) – μ. |
(5) |
|
|
(6) |
It turns out (again, see the Additional Topic for a derivation) that the minimum of the expected variance is achieved under the condition
ΣφiC(xi,xi + hij) – C(xi,x) = 0, i = 1,…,n. (7)
The equations (7) are called the simple kriging equations.
Equations (7) can be written in matrix form. If we let the n by n matrix C have elements Cij = C(xi,xi +hij) (hopefully this abuse of notation is not confusing: C is a matrix and C(xi,xi +hij) is the covariance between locations xi and xi + hij, and let the vector c have components C(xi,x) then a system of n equations of the form of Equation (7) for the n coefficients φi can be written as the matrix equation
Cφ = c. (8)
The values of φ the can be determined by solving Equation (8). This is not, however, the most computationally efficient way to compute these quantities, as will be discussed below. We will follow in the footsteps of Leuangthong et al. (2008) and create a simple four-point example in which we can directly compute the appropriate simple kriging quantities. In our case we will use the four points in the northwest corner of the sample set. We will krige on the quantity Z, the value of Yield minus its mean over the full 78 point data set. > Y.mean <- mean(data.Set4.2$Yield)
> data.Set4.2$Z <- data.Set4.2$Yield – Y.mean
> data.4pts <- data.Set4.2[which(data.Set4.2$Easting < 592200 &
+ data.Set4.2$Northing > 4267750),]
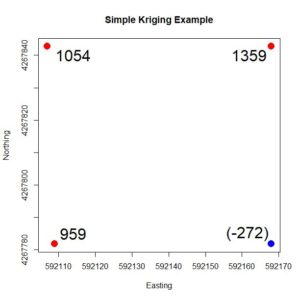
Figure 4. Simple four-point example, showing the Z values. The value at the blue point is to be estimated based on the values at the red points. Fig. 4 shows the four points. We will use the values of the three points shown in red to estimate the value of the point shown in blue. The values of Z are shown at each point. We can anticipate that the value of the blue point will be seriously overestimated, which illustrates the smoothing nature of kriging described above. First, we compute the distance matrix of these points and then we apply the variogram formula computed in Section 1. The way this is coded we need to be careful about the order of the data and make sure that the point to be estimated is the last in that order. > print(h4.mat <-as.matrix(with(data.4pts,
+ dist(cbind(Easting, Northing))))
1 2 3 4
1 0.00000 61.0000 61.03278 86.26703
2 61.00000 0.0000 84.86460 61.00000
3 61.03278 84.8646 0.00000 59.00000
4 86.26703 61.0000 59.00000 0.00000
> print(nugget <- data.fit$psill[1])
[1] 0
> print(psill <- data.fit$psill[2])
[1] 1533706
> print(rnge <- data.fit$range[2])
[1] 248.2806
Using the formula for the spherical variogram given by Issacs and Srivastava (1997), we can construct a function sph.vgm() in terms of the nugget, the partial sill, and the range (the sill is the sum of the nugget and the partial sill). Here is the computation of the variogram matrix. > sph.vgm <- function(nug, psill, rnge, hh){
+ if (hh == 0) return(0)
+ if (hh > rnge) return(nug + psill)
+ return(nug + psill*((3*hh)/(2*rnge) – 0.5 * (hh/rnge)^3))
+ }
> gam.mat <- matrix(0, 4, 4)
> for (i in 1:4)
+ for (j in 1:4)
+ gam.mat[i,j] <- sph.vgm(0, psill, rnge, h4.mat[i,j])
> gam.mat
[,1] [,2] [,3] [,4]
[1,] 0.0 553850.7 554136.1 767179.4
[2,] 553850.7 0.0 755728.0 553850.7
[3,] 554136.1 755728.0 0.0 536401.1
[4,] 767179.4 553850.7 536401.1 0.0 We can then use Equation (5) to compute the variance-covariance matrix > # The fourth point is the point to be estimated
> print(C.full <- nugget + psill – gam.mat)
[,1] [,2] [,3] [,4]
[1,] 1533705.6 979855.0 979569.6 766526.3
[2,] 979855.0 1533705.6 777977.7 979855.0
[3,] 979569.6 777977.7 1533705.6 997304.5
[4,] 766526.3 979855.0 997304.5 1533705.6 The matrix C in Equation (8) is the 3 x 3 upper left corner of C.full and the vector c is the first three elements of the fourth column. We can solve Equation (8) for φ and then compute the simple kriging estimate of Z.
> C.mat <- Cfull[1:3, 1:3]
> c.vec <- Cfull[1:3,4]
> print(phi <- solve(C.mat, c.vec))
[1] -0.1015358 0.4591511 0.4822024
> print(Z.est <- sum(phi * data.4pts$Z[1:3]))
[1] 979.1371 As predicted, the estimate is rather poor, since the true value of Z is anomalously low. In the next subsection we will see that the simple kriging Equation (8) can be expressed as a linear regression model.
c. Regression digression
The derivation in Subsection b showed that the simple kriging estimator is the best linear unbiased estimator in the sense that among unbiased estimators it minimizes the variance of the error. The Gauss-Markov theorem (Kutner et al., 2005, p. 18) states that the estimator of the linear regression model is the best linear unbiased estimator. It must therefore be the case that the solution of the simple kriging equations is the same as that of corresponding linear regression equation. The purpose of this brief subsection is to give an informal argument to show this. SDA2 Appendix A.2 contains a discussion of the equations of multiple linear regression. We will reproduce some of this discussion here. Multiple linear regression provides the least squares estimate for the parameters of the model
Here I have changed to a nonstandard notation different from that of SDA2 but matching that of this Additional Topic. To observe the analogy between simple kriging and linear regression we will be concerned with the special case in which β0 = 0. (regression through the mean). The reason β0 = 0 is that simple kriging is concerned with estimating the value of a quantity Z having mean 0, and this corresponds to regression through the mean. The equations for the regression model turn out to be (again, see the Additional Topic for a derivation) ΣjβjXiXj – XiY = 0, i = 1, … n . (10)
If we compare this equation with Equation (7), the simple kriging equations, which is repeated here,
ΣφiC(xi,xi + hij) – C(xi,x) = 0, i = 1,…,n. (11)
we can see that
XiXj = C(xi,xj), φi = βi, XiY = C(xi,x) . (12)
Thus, we have shown (albeit with a bit of hand waving) that simple kriging does indeed produce the same result as linear regression. In the next subsection we will see that they are also the same as those generated by Bayes’ rule.
d. Bayesian statistics
Recall that Bayes’ rule is written as follows. Let A and B be two events. The joint probability, denoted P{A,B}, is the probability that both events A and B occur. The conditional probability that A occurs given that B occurs is denoted P{A|B}, and one can similarly define the conditional probability P{B|A} that B occurs given that A occurs. The laws of probability state that (Larsen and Marx, 86, p. 42)
| P{A,B} = P{A|B}P{B} = P{B|A} P{A}, | (13) |
If we have observed the event A then Bayes’ rule gives us a means to compute the probability that B occurs given this observation together with any prior information that we may already have about event B. In order to describe how Bayes’ rule is applied to conditional simulation we will shift from a model expressed in terms of events A and B to one in which the probabilities involve two scalar quantities y1 and y2. The following discussion is taken primarily from Leuangthong et al. (2008, p. 107), although I have changed the notation to better match mine. Rather than considering the probability of events, we consider probability densities, which we denote with a lower case p. We will assume that our objective is to compute the value of the quantity Y2 based on having computed the value of Y1, and that p(y1) and p(y2) represent probability densities of the values of Y1 andY2. Bayes’ rule becomes
 . (15)
The density p(y2|y1) is in geostatistics generally called the conditional density, p(y1,y2) is called the joint density, and p(y1) is called the marginal density. I should note that if you are familiar with Bayesian statistics in the context of subjective probability theory then both the terminology and the concepts as applied here are slightly different and should not be confused. The formula for the probability density of a univariate distribution of a Gaussian random variable with mean m and variance is (Larsen and Marx, 1986, p. 210)
 . (16)
I will not repeat the mathematical derivations here (again, see the Additional Topic) but note that they are based on Leuangthong et al. (2008, p. 108). They show that if the distribution p(y1) of Y1 is Gaussian (i.e., normal) then the conditional density p(y2|y1) of Y2 is also Gaussian. This property, that the densities all have the same Gaussian form, is a rare one not shared by other probability densities. It is a primary reason why we do conditional Gaussian simulation. The great advantage of taking a Bayesian approach to conditional Gaussian simulation is that it facilitates the successive incorporation of the new data at each step of the simulation process (i.e. at each new visit to a point to be simulated). This incorporation is described, for example, by Leuangthong et al. (2008, p. 109) and by Goovaerts (1997, p. 376). Basically, once we know Y1 = y1, we can compute Y2 = y2 based on the formulas given above. Once we know Y2 = y2, we can compute Y3 = y3, and so forth. In other words, the calculation at each new visit point is a computationally simple matter of Bayesian updating. As described by Goovaerts, this provides tremendous efficiency in the simulation. This is the way that the computations are carried out in software such as the gstat package. The presentation of the algorithm is simplified, however, if one adopts a simple matrix inversion approach like that used in the four-point example above, and this is what we shall do in Section 3. Because they use Bayesian updating of a Gaussian distribution, however, R library algorithms such as those in gstat require that the data be normally distributed, and for this reason if they are not then they must be transformed. That is the subject of the next subsection.
e. The normal scores transformation
If you have had a course in linear regression, one of the topics you probably covered was transforming the data to a form that more closely fits the assumptions made to derive the method. The situation is similar with conditional simulation, but the objective is different. Linear regression is fairly robust to deviations from normality of the distribution of errors but is highly sensitive to deviations in error magnitude, and for this reason transformations may be carried out to “stabilize the variance,” that is, to make the error distribution more homogeneous. Conditional Gaussian simulation, on the other hand, assumes a normal distribution of the data, and thus data whose distribution is not Gaussian must be transformed to come closer to matching this assumption. The standard transformation used in geostatistics is called the normal scores transformation and is quite simple to describe and implement. It is described by Pyrcz and Deutsch (2018) and by Goovaerts (1997); we will follow the nice description by Goovaerts (1997, p. 268). Step 1. Arrange the sample data in ascending order, breaking ties if necessary. > # First compute normal scores of Yield at sample points:
> # Arrange Yield values in ascending order
> # data.Set4.2 is the original sample data, still a data frame
> data.Yield.ord <- data.Set4.2$Yield[order(data.Set4.2$Yield)]
> # Check for ties
> min(diff(data.Yield.ord))
[1] 0.5649183 Step 2. Compute the cumulative frequency of the ordered data values (i.e., the quantiles). In the next section we will also need their coordinates as well as their record numbers so we will include these as well. > data.Set4.2.ord <- data.frame(Yield = data.Yield.ord,
+ Yquant = seq(1:length(data.Yield.ord)) /
+ length(data.Yield.ord),
+ Easting = data.Set4.2$Easting[order(data.Set4.2$Yield)],
+ Northing = data.Set4.2$Northing[order(data.Set4.2$Yield)],
+ ptno = data.Set4.2$ptno[order(data.Set4.2$Yield)]) Step 3. Match the quantile of each of the ordered values with the corresponding quantile of the normal distribution. > data.ordered$Z <- qnorm(data.ordered$Yquant)
> data.ordered$Z[length(data.ordered$Z)]
[1] Inf
> data.Set4.2.ord$Z[length(data.Set4.2.ord$Z) – 1]
[1] 2.231606
> data.ordered$Z[length(data.ordered$Z)] <- 3.0 The function qnorm() assigns the value Inf to the largest quantile, so this replaced with a suitably large finite value. In theory the normal score transformation produces a quantity Z(x) with mean exactly zero, but in practice numerical issues plus our adjustment of the largest quantile may upset this a bit, so we will adjust the values to return their mean to zero, > # Give the z values a mean of zero
> mean(data.Set4.2.ord$Z)
[1] 0.03846154
> data.Set4.2.ord$Z <- data.Set4.2.ord$Z – mean(data.Set4.2.ord$Z) Fig. 5 shows the normal score transformation schematically. The fiftieth quantile Yield out of 78 has the value 5167 kg, and corresponds to the quantile value 50/78 = 0.64. The quantile value 0.64 of the normal distribution on the right corresponds to the value 0.32, which is the normal score.
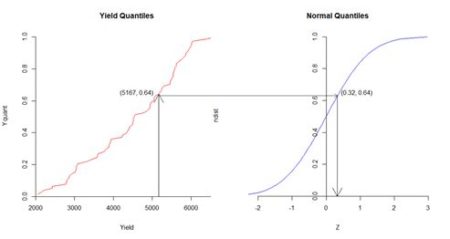 Figure 5. Diagrammatic representation of normal score transformation. Based on similar figures by Goovaerts (1997, p. 268) and Pyrcz and Deutsch (2018).
After the Gaussian simulation is completed the results must be transformed back to the original data units. Because the data are so densely arranged, this can be accomplished by simple linear interpolation.
3. The Conditional Gaussian Simulation Algorithm
In Section 2 we created a normal score transformation Z of the yields of the sample points. We will use this transformed quantity in the simulation. Here are the steps.
Step 1, the visit order. Since we start with a set of 78 locations whose Z value is known, we will randomly pick one of these as are starting point. Then we randomly arrange all the locations, sampled and unsampled.
> set.seed(123)> print(pt1 <- sample(samp.pts, 1))
[1] 5763
> visit.order <- sample(1:length(data.Full.ordered$Z),
+ replace = FALSE)
> visit.order <- c(pt1, visit.order[-which(visit.order == pt1)])
> visit.order[1:10]
[1] 5763 2463 2511 8718 2986 1842 9334 3371 4761 6746 Step 2. At the current visit point, if it is a sample point, insert its known value. If not, determine the parameters (mean and variance) of the Gaussian cumulative distribution function using simple kriging of nearby known values. This where software such as gstat uses Bayesian updating and we will use simple matrix inversion. We will base our estimate on the ten closest points whose value has already been determined. We create a data field Zsim in the original sf object Y.full.data.sf to hold the simulated values. We also determine the quantities to be used in the simple kriging. > Y.full.data.sf$Zsim <- 0
> data.varn <- variogram(object = Z ~ 1, locations =
+ data.Set4.2.ord.sp, cutoff = 600)
> data.fitn <- fit.variogram(object = data.varn, model =
+ vgm(1, “Sph”, 250, 1))
> print(Z.nug <- data.fitn$psill[1])
[1] 0
> print(Z.sill <- Z.nug + data.fitn$psill[2])
[1] 1.157344
> print(Z.range <- data.fitn$range[2])
[1] 239.7456
> n.kr.pts <- 10 The variogram() argument cutoff is the spatial separation distance up to which point pairs are included in the computation. The arguments of the function vgm() are respectively the initial guess of the partial sill, the model, and the initial guesses of the range and the nugget. Again, the partial sill is the sill minus the nugget. Fig. 6 shows the setup for the 100th visit point. The point to be simulated is shown in red, the sample points are shown in green, and the points whose Z values have already been simulated are shown in blue. It is evident that the simulation is based on a combination of sample values and previously simulated values.
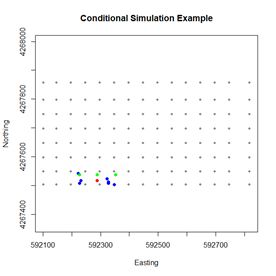 Figure 6. Diagram of the simulation data for the one hundredth visit point.
Next we create a function closest.points() to find the closest points to the current visit point. The argument coord.data is used to pass the data frame Y.full.data.sf. The argument n.pts has the value 10.
> closest.points <- function(visit.pt, coord.data,
Figure 6. Diagram of the simulation data for the one hundredth visit point.
Next we create a function closest.points() to find the closest points to the current visit point. The argument coord.data is used to pass the data frame Y.full.data.sf. The argument n.pts has the value 10.
> closest.points <- function(visit.pt, coord.data,+ known.pts, n.pts){
+ c.pts <- numeric(n.pts)
+ # Determine the coordinates of the current visit point
+ visit.coords <- with(coord.data, c(Easting[visit.pt],
+ Northing[visit.pt]))
+ # Determine the coordinates of all the points whose value is known
+ known.coords <- with(coord.data,
+ cbind(Easting[known.pts], Northing[known.pts]))
+ # Respectively go through the known points and find the
+ # n.pts closest points
+ test.coords <- known.coords
+ for (n in 1:(n.pts + 1)){
+ dist.sq <- (test.coords[,1] – visit.coords[1])^2 +
+ (test.coords[,2] – visit.coords[2])^2
+ min.pt <- which.min(dist.sq)
+ c.pts[n] <- known.pts[min.pt]
# Once a point is selected, change its coordinates to an
# impossible value to keep it from being selected again
+ test.coords[min.pt,] <- 0
+ }
+ return(c.pts)
+ } We use the array known.pts to hold the indices of the locations whose Z value is known. Initially these are the sample points. > known.pts <- samp.pts At each point in the visit order, if it is a sample then that value is used (Step 2a). These values are assigned at the start > for (i in 1:length(samp.pts))
+ Y.full.data.sf$Zsim[samp.pts[i]] <- with(data.Set4.2.ord,
+ Z[which(ptno == samp.pts[i])]) If the visit point is not a sample point then the Monte Carlo computation is implemented. Rather than using the R function dist() to compute the distance matrix, as was done for the simple four point example, it is more convenient to use our own function to compute the distances. > pt.dist <- function(x1, x2) sqrt(sum((x1 – x2)^2)) There is a lot of code, so I have tried to liberally include comments to explain what is going on. The drawing of the value from the normal distribution takes place at the end of the loop. The first line of code sets up the cycling through the visit points. > for (visit.pt in visit.order){
+ # If visit point not a sample point use the kriging variance to
+ # construct the distribution and draw a value from this
+ distribution
+ if (!(visit.pt %in% samp.pts)){
+ # Find the closest points to the visit point
+ cl.pts <- closest.points(visit.pt, Y.full.data.sf,
+ known.pts, n.kr.pts)
+ # Add the visit point to end of the set of closest points
+ krige.pts <- c(cl.pts, visit.pt)
+ # Determine the distance matrix
+ h.mat <- matrix(0, length(krige.pts), length(krige.pts))
+ for (i in 1:length(krige.pts))
+ for (j in 1:length(krige.pts)){
+ x1 <- with(Y.full.data.sf,
+ c(Easting[krige.pts[i]],Northing[krige.pts[i]]))
+ x2 <- with(Y.full.data.sf,
+ c(Easting[krige.pts[j]],Northing[krige.pts[j]]))
+ h.mat[i,j] <- pt.dist(x1, x2)
+ }
+ # Determine the gamma matrix
+ gam.mat <- matrix(0, nrow(h.mat), nrow(h.mat))
+ for (i in 1:(n.kr.pts + 1))
+ for (j in 1:(n.kr.pts + 1))
+ gam.mat[i,j] <-
+ sph.vgm(Z.nug, Z.sill, Z.range, h.mat[i,j])
+ C.full <- Z.sill – gam.mat
+ C.mat <- C.full[1:(n.kr.pts), 1:(n.kr.pts)]
+ c.vec <- C.full[1:(n.kr.pts),(n.kr.pts + 1)]
+ # Solve for the phi values
+ phi <- solve(C.mat, c.vec)
+ #Estimate the mean via simple kriging
+ mu.est <- sum(phi * Y.full.data.sf$Zsim[cl.pts])
+ # Variance equals the sill
+ sd.est <- sqrt(Z.sill)
+ # Draw a value from a normal distribution with these parameters
+ Y.full.data.sf$Zsim[visit.pt] <- rnorm(1, mu.est, sd.est)
+ # Add the visit point to the list of known points
+ known.pts <- c(known.pts, visit.pt)
+ }
+ } If you use the code accompanying this post to run this example, then as you watch the little blue wheel go around, think about the fact that when we repeat this example in the next section using the gstat function krige(), the computation will be effectively instantaneous. R library functions are generally better than anything we could make by hand. Finally, we use interpolation to transform the simulation back to the original scale (the function to do this was created in Section 1 but will be shown in Section 4). Fig. 6 shows the result. It is a considerably cruder simulation of the original data, although it does preserve some of the reduction in yield on the west side of the field.
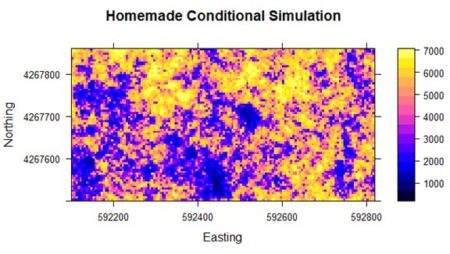
Figure 6. Results of the “homemade” conditional simulation. Although the homemade simulation is clearly much cruder, the general yield pattern is still discernable. In the next section we will go through the same code as was used in Section 1 to illustrate the use of the gstat package to carry out conditional and unconditional Gaussian simulation.
4. Conditional and Unconditional Gaussian Simulation using gstat
Now that we have an idea of how conditional Gaussian simulation works, we will go over the code used to generate Figs. 2b and 3 in Section 1. After that we will create code to generate an unconditional Gaussian simulation and compare the two. The R code in the code file accompanying this Additional topic is repeated to match the presentation order here. The first step is the normal score transformation of the 78 sample points. This has already been described in Subsection 2e. The next step is to create a SpatialPointsDataFrame for the gstat function variogram() to compute and fit the variogram. We have already seen the last four lines of code in Section 3.> coordinates(data.ordered) <- c(“Easting”, “Northing”)
> proj4string(data.ordered) <- CRS(“+proj=utm +zone=10 +ellps=WGS84”)
> data.varn <- variogram(object = Z ~ 1,
+ locations = data.ordered, cutoff = 600)
> data.fitn <- fit.variogram(object = data.varn,
+ model = vgm(1, “Sph”, 250, 1))
The last step is the actual computation of the conditional Gaussian simulation. > Z.sim <- krige(formula = Z ~ 1, locations = data.ordered,+ newdata = Y.full.data.sp, model = data.fitn, nmax = 10, nsim = 6)
drawing 6 GLS realisations of beta…
[using conditional Gaussian simulation]
> class(Z.sim)
[1] “SpatialPixelsDataFrame”
attr(,”package”)
[1] “sp”
> spplot(Z.sim) # Check Note the I am using krige() to carry out the conditional simulation. There are other ways to do it but I find this the most straightforward. The function krige() is a “wrapper” for the function gstat() A wrapper function provides a more convenient interface to another function, often for certain specialized applications. The argument locations contains the known data values, in the form of a Spatial object such as a SpatialPointsDataFrame, and the argument newdata contains the locations at which the simulation values are to be computed, again in the form of a Spatial object. In this case I use a SpatialPixelsDataFrame. The argument nsim is the number of simulations to be computed. The function gstat() is so efficient that it does not take much more time to compute 100, or ever 1000, simulations than to compute one (You will use this feature in Exercise 3). The last step in the code above is to do a quick and dirty plot to check that the result is reasonable.
The code for the function krige() when used for ordinary kriging is very similar to that used for conditional Gaussian simulation, so let’s take a look at the former in order to compare the two. Here is the call to the function krige() used to produce Fig. 2a. > Yield.krige <- krige(formula = Yield ~ 1,
+ locations = data.Set4.2.sp, newdata = Y.full.data.sp,
+ model = data.fit) The difference in the two function calls is the assignment of a positive value to the argument nsim in the conditional Gaussian simulation (the default value of nsim is zero). This positive value signals that conditional Gaussian simulation rather than kriging is to be used. The value of the argument nsim if it is not zero indicates the number of simulations to be computed. The argument nmax provides an indication of the number of known values to be used, but the algorithm is much more sophisticated than the simple one used in Section 3. The last step in the conditional Gaussian simulation process is to transform the data back to the initial units. As indicated, this is done using simple linear interpolation. We first create an interpolation function xform() and then do the transformation. > xform <- function(in.vec, out.vec, val){
+ i <- 1
+ while (i < length(in.vec) & val >= in.vec[i+1]) i <- i + 1
+ if (i == length(in.vec)) return(out.vec[i])
+ return(out.vec[i] + ((val – in.vec[i]) /
+ (in.vec[i+1] – in.vec[i])) * (out.vec[i+1] – out.vec[i]))
+ }
> # Back transform on a point by point basis
> Yield.sim <- Z.sim
> for(i in 1:nrow(Yield.sim@data)) + for(j in 1:ncol(Yield.sim@data))
+ Yield.sim@data[i,j] <- xform(data.ordered@data$Z,
+ data.ordered@data$Yield, Z.sim@data[i,j]) Now we move on to unconditional Gaussian simulation. The difference between conditional and unconditional simulation is that in unconditional simulation only previously simulated values are used in Step 3a, the establishment of “known” values. The simulation begins with no “known” sample values. Unconditional Gaussian simulation cannot be done using krige() but rather requires the direct use of the function gstat(). The argument dummy = T signals that this is an unconditional simulation. The argument nmax is the number of nearest observations used for a simulation. The object returned by the function gstat() is then used as an argument in the function predict() to generate the actual simulation. > Z.pred <- gstat(formula = Z ~ 1, locations = ~Easting + Northing,
+ dummy = T, beta = 0, model = data.fitn, nmax = 20)
> set.seed(123)
> Z.usim <- predict(Z.pred, newdata = Y.full.data.sp, nsim = 6)
[using unconditional Gaussian simulation] In a simple kriging application beta is the value of the mean, which in our Gaussian simulation is zero. Fig. 8 shows a plot of the result. The simulation has the same general local spatial structure as the original data but does not preserve the global spatial pattern.
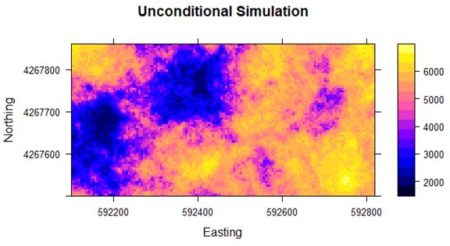 Figure 8. Unconditional simulation using yield data
5. Further Reading
Much of the discussion in this Additional Topic is taken from Leuangthong et al. (2008). Goovaerts (1997) contains the same material, but the presentation is at a higher mathematical level. Wackernagel (2003) and Journel (2009) contain more mathematically sophisticated discussions of the relationship between kriging and linear regression.6. Exercises
- Using the four-point data set of Fig. 6, compute a conditional Gaussian simulation of the fourth point based on the other three.
- Try carrying out conditional simulation on the original Yield data without using the normal score transformation. How does the result compare with that computed here?
- In principle, since a conditional Gaussian simulation is a set of pointwise Monte Carlo simulations, the mean of a large number of simulations should converge to the kriged interpolation. Compute 10, 100, 1000 simulations of the normalized data and see if they do converge.
- A naïve way to address the problems associated with kriging would be to simply krige the data and then add a normally distributed random variable to each kriged value using the variance as computed from the variogram. Try this out and compare the results with those obtained using conditional Gaussian simulation. How do you explain the difference?
- One of Goovaerts’ assertion about kriging is that smoothing is least close to the data locations and increases as the location being estimated gets farther away. Using the variogram information from the full 78 sample points (computing a variogram with only 39 data points is not wise), carry out a kriging interpolation and a conditional Gaussian simulation based on only the western half of the sample data and see whether kriging in the “unsampled” eastern half is indeed smoother than the simulation.
- Using multiple simulations, construct several histogram and variogram comparisons similar to those of Fig. 4b and Fig. 5b and see how they compare with each other.
