Tabular ML in R: an overview of tidymodels in R for tabularized data workshop

Join our workshop on Tabular ML in R: an overview of tidymodels in R for tabularized data, which is a part of our workshops for Ukraine series! 


Here’s some more info: 


Title: Tabular ML in R: an overview of tidymodels in R for tabularized data


Date: Thursday, February 20th, 18:00 – 20:00 CET (Rome, Berlin, Paris timezone)


Speaker: Frank Hull is currently Director of Analytics at ACES. Frank oversees ACES’ Data Science department, which works directly with Portfolio Strategy, Portfolio Modeling, Transmission, Resource Planning, Fundamentals, and Trading & Operations. Frank leads & advises various initiatives such as weather-driven stochastics (WDS), long-term load forecasting (LTLF), peak prediction services (PPS), dark calm (DC) and extreme weather event (EWE) analyses. Frank also hosts internal R meetings for programmers at ACES. Prior to his current role, Frank held various roles related to data science, systems, modeling, and quantitative analysis at AES & ACES. Frank holds a degree in physics with a concentration in engineering physics.


Description: In this workshop, we will 1) discuss what we mean by tabular ml in R, 2) why it’s important, 3) when can it be applicable, and 4) how to setup a robust pipeline for iterative machine learning workflows. We will start off by defining and discussing the prevalence of tabular data across sectors. Followed by data exploration to understand and interpret any known relationships with our example dataset. Lastly, we will establish key practices within the

tidymodels ecosystem to create a predictive framework and benchmark various ML engines.


Minimal registration fee: 20 euro (or 20 USD or 800 UAH)


How can I register?


  • Save your donation receipt (after the donation is processed, there is an option to enter your email address on the website to which the donation receipt is sent)

  • Fill in the registration form, attaching a screenshot of a donation receipt (please attach the screenshot of the donation receipt that was emailed to you rather than the page you see after donation).

If you are not personally interested in attending, you can also contribute by sponsoring a participation of a student, who will then be able to participate for free. If you choose to sponsor a student, all proceeds will also go directly to organisations working in Ukraine. You can either sponsor a particular student or you can leave it up to us so that we can allocate the sponsored place to students who have signed up for the waiting list.


How can I sponsor a student?


  • Save your donation receipt (after the donation is processed, there is an option to enter your email address on the website to which the donation receipt is sent)

  • Fill in the sponsorship form, attaching the screenshot of the donation receipt (please attach the screenshot of the donation receipt that was emailed to you rather than the page you see after the donation). You can indicate whether you want to sponsor a particular student or we can allocate this spot ourselves to the students from the waiting list. You can also indicate whether you prefer us to prioritize students from developing countries when assigning place(s) that you sponsored.


If you are a university student and cannot afford the registration fee, you can also sign up for the waiting list here. (Note that you are not guaranteed to participate by signing up for the waiting list).


You can also find more information about this workshop series,  a schedule of our future workshops as well as a list of our past workshops which you can get the recordings & materials here.


Looking forward to seeing you during the workshop!


Flowcharts made easy with the package {flowchart}

In health research, a flowchart is the best way to show the flow of participants in a study when reporting results. But drawing flowcharts can be tedious to prepare and can get on your nerves.


Fortunately, there are several packages in R for drawing flowcharts using different approaches. The problem is that the programming is generally quite complex, and the numbers have to be entered manually or parameterized beforehand. These flowcharts can have reproducible problems because if data changes, we have to manually change the parameters again.

To make our lives easier, there’s a new {flowchart} package that uses the tidyverse workflow, which allows to create many different types of flowcharts in just a few steps.

https://bruigtp.github.io/flowchart


The package provides a set of functions that are thought to be combined with a tidyverse pipe operator (%>% or |>) to create different flowchart designs directly from the study database. These functions are highly customizable and allow the user to create reproducible flowcharts in an easier and tidier way. Now we don’t need to manually set the flowchart parameters such as the box coordinates or the numbers to display, because it automatically adapts to the data we have.

For example, we can create a flowchart of the entire participant study flow with this simple tidy workflow:

Here, we will describe these steps that are involved in creating a flowchart in this example. We will use the built-in safo dataset, that comes with the package, which is a randomly generated dataset from the SAFO clinical trial. For more information and other examples, you can visit the vignette of the package.

Installing and loading the package

As of March of 2024, the package is available on CRAN:

install.packages("flowchart")

You can always install the development version from Github:

remotes::install_github("bruigtp/flowchart")

Initialize the flowchart

The first step is the initialisation of the flowchart with the function as_fc():

library(flowchart) 

x <- safo |> 
  as_fc(label = "Patients assessed for eligibility")

This will create an object of class fc, the class created for this package. Objects of this class consist of a list containing the dataset together with the information related to the flowchart being generated. Let’s see it for our example:

str(x, max.level = 1)
List of 2
 $ data: tibble [925 × 21] (S3: tbl_df/tbl/data.frame)
 $ fc  : tibble [1 × 17] (S3: tbl_df/tbl/data.frame)
 - attr(*, "class")= chr "fc"

The data tibble belongs to the entire SAFO dataset as we haven’t done any further operations:

x$data
# A tibble: 925 × 21
      id inclusion_crit exclusion_crit chronic_heart_failure expected_death_24h
   <int> <fct>          <fct>          <fct>                 <fct>             
 1     1 Yes            No             No                    No                
 2     2 No             No             No                    No                
 3     3 No             No             No                    No                
 4     4 No             Yes            No                    No                
 5     5 No             No             No                    No                
 6     6 No             Yes            No                    No                
 7     7 No             No             No                    No                
 8     8 No             Yes            No                    Yes               
 9     9 No             No             No                    No                
10    10 No             No             No                    No                
# ℹ 915 more rows
# ℹ 16 more variables: polymicrobial_bacteremia <fct>,
#   conditions_affect_adhrence <fct>, susp_prosthetic_valve_endocard <fct>,
#   severe_liver_cirrhosis <fct>, acute_sars_cov2 <fct>,
#   blactam_fosfomycin_hypersens <fct>, other_clinical_trial <fct>,
#   pregnancy_or_breastfeeding <fct>, previous_participation <fct>,
#   myasthenia_gravis <fct>, decline_part <fct>, group <fct>, itt <fct>, …

The fc tibble represents the information on the generated flowchart, which only contains a first initial box indicating the total number of patients assessed for eligibility in the SAFO trial:

x$fc
# A tibble: 1 × 17
     id     x     y     n     N perc  text  type  group just  text_color text_fs
  <dbl> <dbl> <dbl> <int> <int> <chr> <chr> <chr> <lgl> <chr> <chr>        <dbl>
1     1   0.5   0.5   925   925 100   "Pat… init  NA    cent… black            8
# ℹ 5 more variables: text_fface <dbl>, text_ffamily <lgl>, text_padding <dbl>,
#   bg_fill <chr>, border_color <chr>

Drawing the flowchart

We can always use the fc_draw() function to draw the associated flowchart from a fc object:

x |> 
  fc_draw()

Building the flowchart

To build the entire flowchart, we would need to combine the initialized fc object with the desired functions until we obtain the final flowchart.

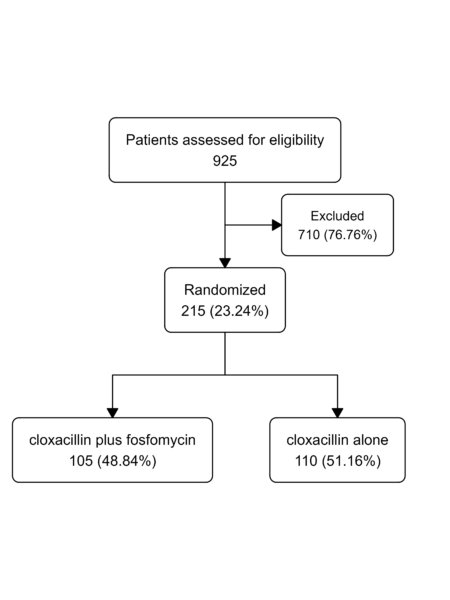
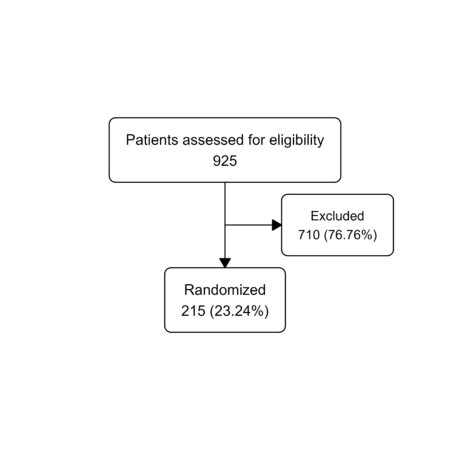
The second box showing the patients excluded from randomization can be obtained using the fc_filter() function:

safo |> 
  as_fc(label = "Patients assessed for eligibility") |> 
  fc_filter(!is.na(group), label = "Randomized", show_exc = TRUE) |> 
  fc_draw()

with show_exc = TRUE to show the excluded subject box as well. Now $data contains the database filtered only for the randomized subjects while $fc contains the information for these new boxes.

Now, we can split the flowchart by the study group, using the fc_split() function:

safo |> 
  as_fc(label = "Patients assessed for eligibility") |> 
  fc_filter(!is.na(group), label = "Randomized", show_exc = TRUE) |> 
  fc_split(group) |> 
  fc_draw()

Now, $data contains the previously filtered database that has been grouped by the group variable.

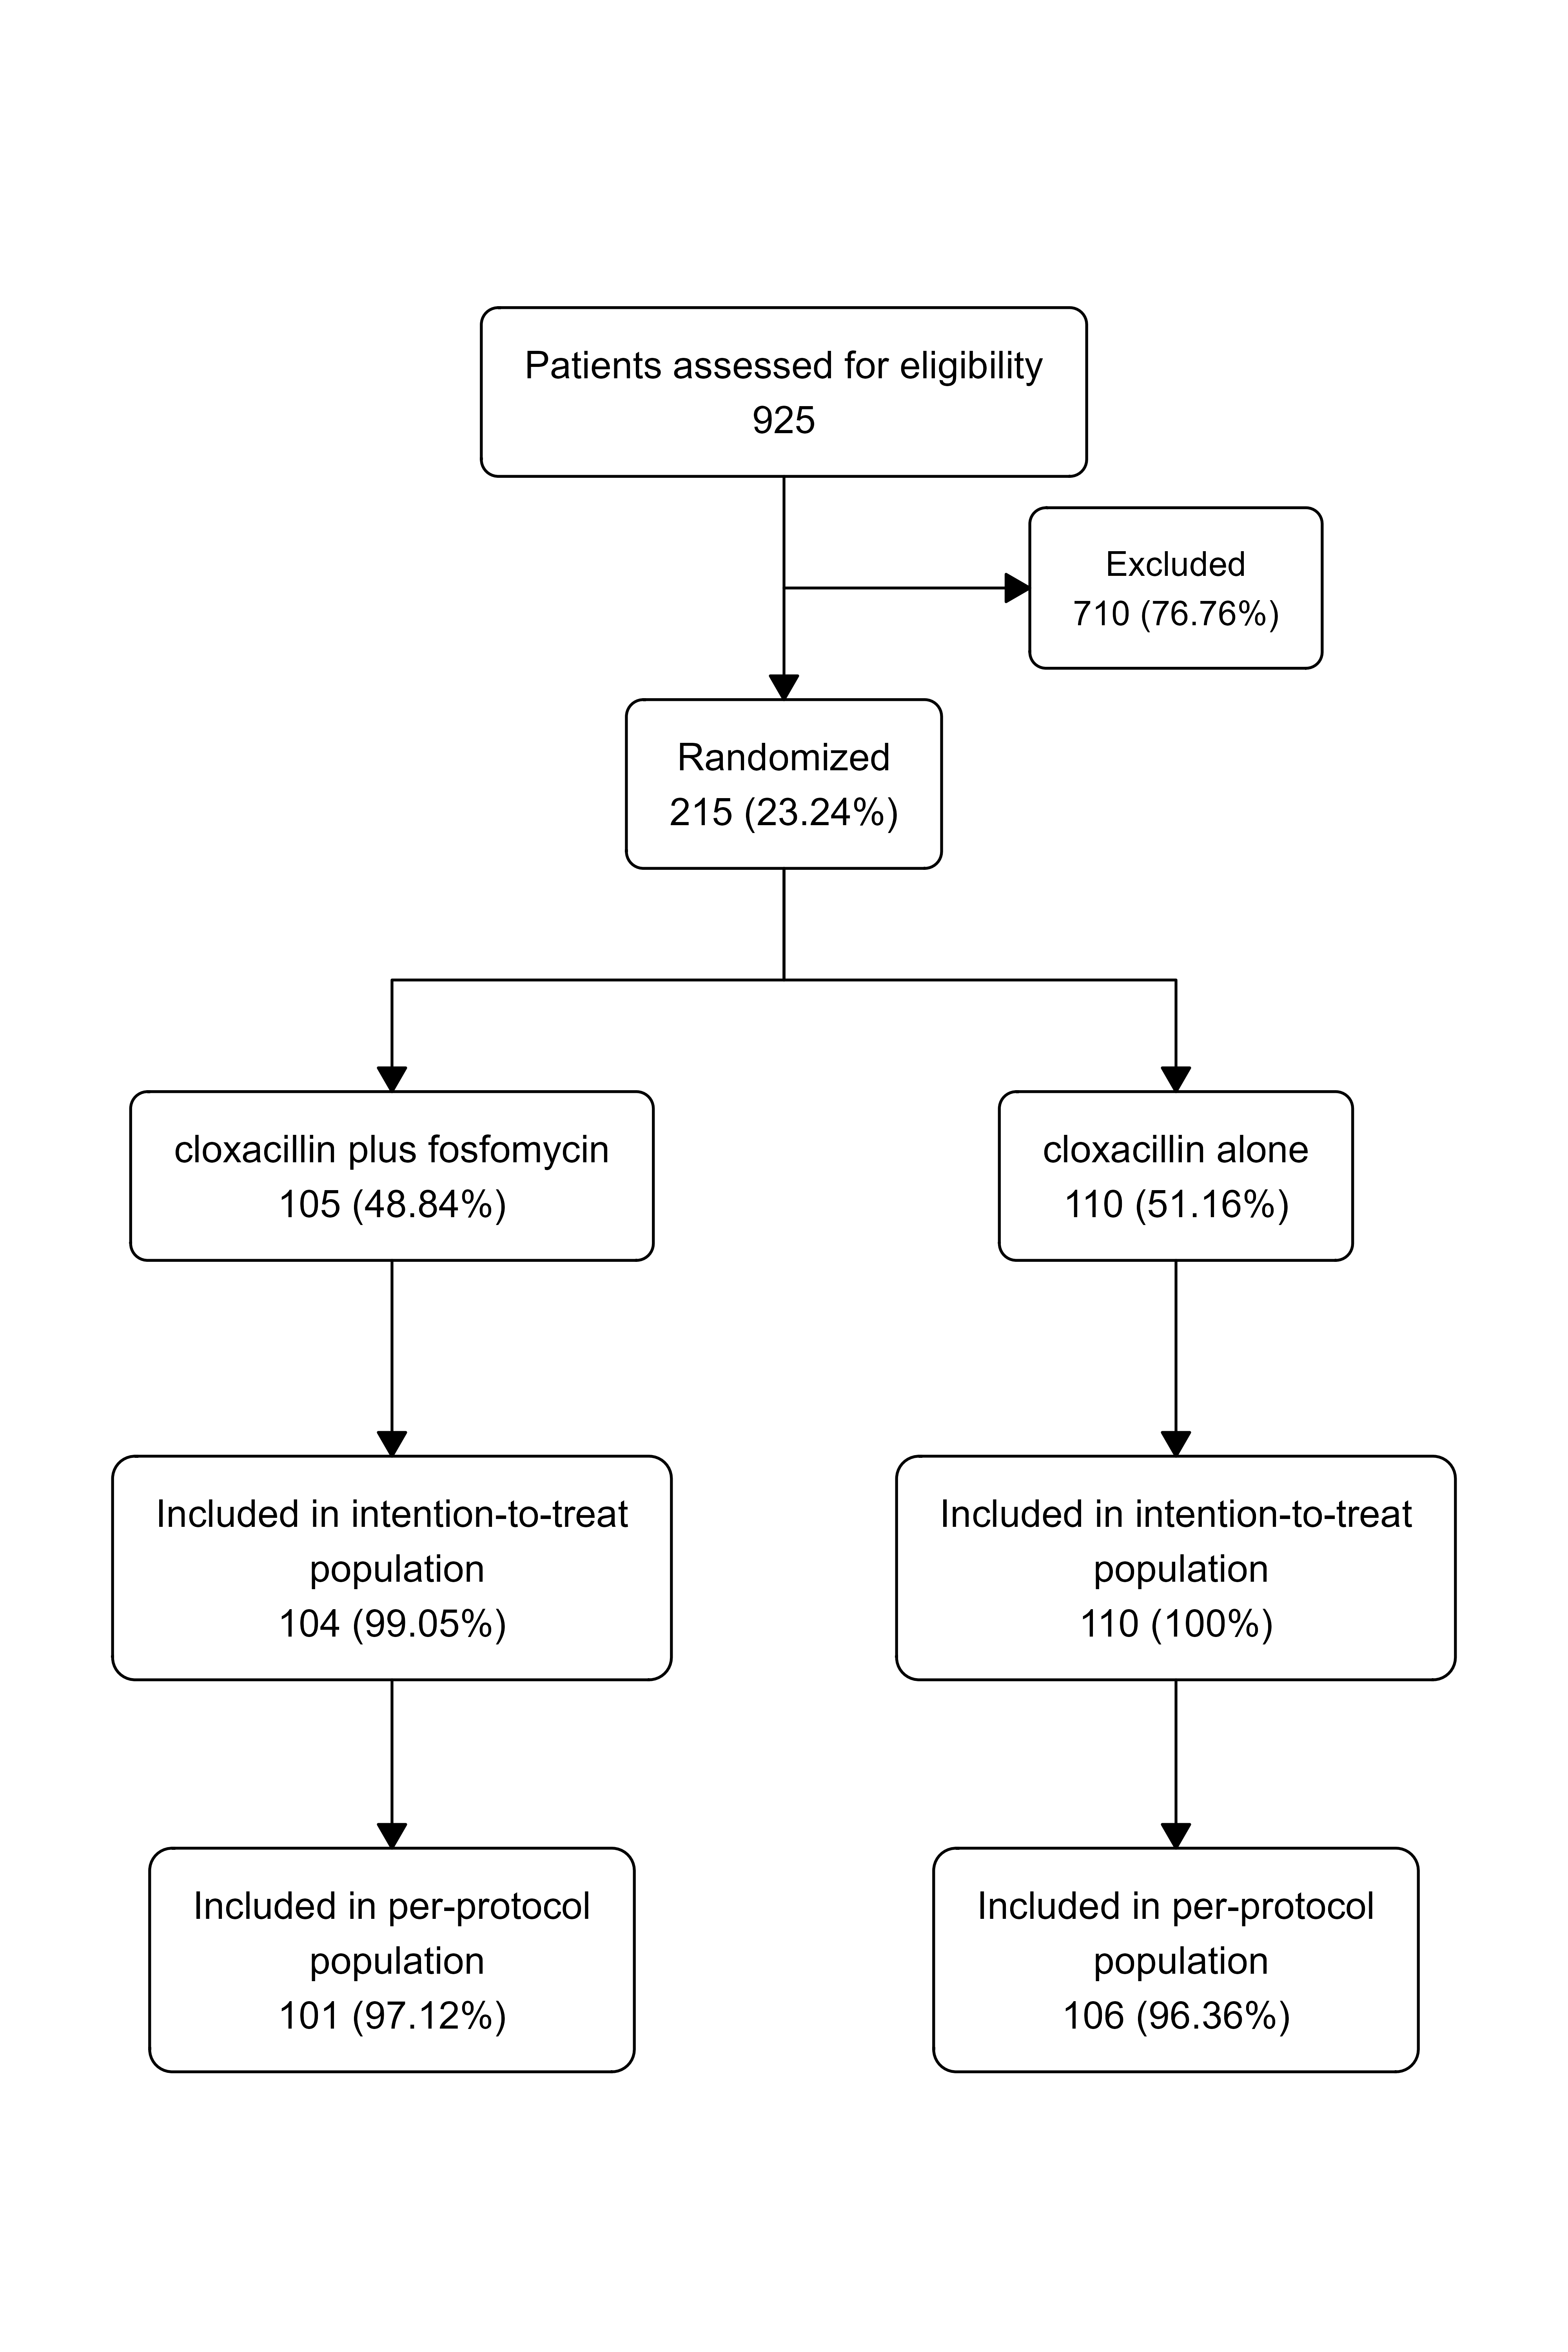
Finally, we can apply two more times the fc_filter() function to generate the complete flowchart we want:

safo |> 
    as_fc(label = "Patients assessed for eligibility") |> 
    fc_filter(!is.na(group), label = "Randomized", show_exc = TRUE) |> 
    fc_split(group) |> 
    fc_filter(itt == "Yes", label = "Included in intention-to-treat\n population") |> 
    fc_filter(pp == "Yes", label = "Included in per-protocol\n population") |> 
    fc_draw()

The idea is to combine these basic functions, fc_filter() and fc_split(), in any way we want to create the desired flowchart. The resulting flowchart can be further customized and enhanced using the fc_modify() function, or combined with other flowcharts either horizontally or vertically using the fc_merge() and fc_stack() functions, respectively. Finally, once the final flowchart is drawn, it can be exported to the desired image format using the  fc_export() function.

More information about these features and other examples can be found in the website of the package: https://bruigtp.github.io/flowchart/.

{SLmetrics}: scalable and memory efficient AI/ML performance evaluation in R

On December 3rd, 2024, a post about the release of {SLmetrics} was published. Today, January 11th, 2025, version 0.3-1 has been released and comes with many new features. Among these are weighted classification and regression metrics, OpenMP support and a wide array of new evaluation metrics.

In this blog post, I will benchmark {SLmetrics} and demostrate how it compares to the similar R packages {MLmetrics} and {yardstick} in terms execution time and memory efficiency – essential determinants for scalability and efficiency.

Benchmark Function

To run the benchmark of {SLmetrics}, {MLmetrics} and {yardstick}, I will use {bench} which measures the median execution time and memory efficiency. Below I have created a wrapper function:

## benchmark function
benchmark <- function(
  ..., 
  m = 10) {
  library(magrittr)
  # 1) create list
  # for storing values
  performance <- list()

  for (i in 1:m) {

     # 1) run the benchmarks
    results <- bench::mark(
      ...,
      iterations = 10,
      check = FALSE
    )

    # 2) extract values
    # and calculate medians
    performance$time[[i]]  <- setNames(
        lapply(results$time, mean), 
        results$expression
        )

    performance$memory[[i]] <- setNames(
        lapply(results$memory, function(x) {
             sum(x$bytes, na.rm = TRUE)}
             ), results$expression)

    performance$n_gc[[i]] <- setNames(
        lapply(results$n_gc, sum), results$expression
        )

  }

  purrr::pmap_dfr(
  list(performance$time, performance$memory, performance$n_gc), 
  ~{
    tibble::tibble(
      expression = names(..1),
      time = unlist(..1),
      memory = unlist(..2),
      n_gc = unlist(..3)
    )
  }
) %>%
  dplyr::mutate(expression = factor(expression, levels = unique(expression))) %>%
  dplyr::group_by(expression) %>%
  dplyr::filter(dplyr::row_number() > 1) %>%
  dplyr::summarize(
    execution_time = bench::as_bench_time(median(time)),
    memory_usage = bench::as_bench_bytes(median(memory)),
    gc_calls = median(n_gc),
    .groups = "drop"
  )

}

The wrapper function runs 10 x 10 benchmarks of each passed function – it discards the first run to allow the functions to warm up, before the benchmarks are recorded.

All values are averaged across runs and then presented as the median runtime, median memory usage and median number of gc()-calls during the benchmark.

Benchmarking {SLmetrics}

Bechmarking with and without OpenMP

In the first set of benchmarks, I will demonstrate the new OpenMP feature that has been shipped with version 0.3-1. For the benchmark, we will compare the execution time and memory efficiency of computing a 3×3 confusion matrix on two vectors of length 10,000,000 with and without OpenMP. The source code and results are shown below:

## 1) set seed
set.seed(1903)

## 2) define values
## for classes
actual <- factor(sample(letters[1:3], 1e7, TRUE))
predicted <- factor(sample(letters[1:3], 1e7, TRUE))

## 3) benchmark with OpenMP
SLmetrics::setUseOpenMP(TRUE)
#> OpenMP usage set to: enabled

benchmark(`{With OpenMP}` = SLmetrics::cmatrix(actual, predicted))
#> # A tibble: 1 × 4
#>   expression    execution_time memory_usage gc_calls
#>   <fct>               <bch:tm>    <bch:byt>    <dbl>
#> 1 {With OpenMP}            1ms           0B        0

## 4) benchmark without OpenMP
SLmetrics::setUseOpenMP(FALSE)
#> OpenMP usage set to: disabled

benchmark(`{Without OpenMP}`  = SLmetrics::cmatrix(actual, predicted))
#> # A tibble: 1 × 4
#>   expression       execution_time memory_usage gc_calls
#>   <fct>                  <bch:tm>    <bch:byt>    <dbl>
#> 1 {Without OpenMP}         6.27ms           0B        0

The confusion matrix is computed in less than a millisecond and around six milliseconds with and without OpenMP, respectively. In both cases, it uses zero or near-zero memory.

Benchmarking against {MLmetrics} and {yardstick}

In the second set of benchmarks, I will compare the execution time and memory efficiency of {SLmetrics} against {MLmetrics} and {yardstick}. The source code and results are shown below:

## 1) define classes
set.seed(1903)
fct_actual    <- factor(sample(letters[1:3], size = 1e7, replace = TRUE))
fct_predicted <- factor(sample(letters[1:3], size = 1e7, replace = TRUE))

## 2) perform benchmark
benchmark(
    `{SLmetrics}` = SLmetrics::cmatrix(fct_actual, fct_predicted),
    `{MLmetrics}` = MLmetrics::ConfusionMatrix(fct_predicted, fct_actual),
    `{yardstick}` = yardstick::conf_mat(table(fct_actual, fct_predicted))
)
#> # A tibble: 3 × 4
#>   expression  execution_time memory_usage gc_calls
#>   <fct>             <bch:tm>    <bch:byt>    <dbl>
#> 1 {SLmetrics}         6.34ms           0B        0
#> 2 {MLmetrics}       344.13ms        381MB       19
#> 3 {yardstick}       343.75ms        381MB       19

{SLmetrics} is roughly 60 times faster than both, and significantly more memory efficient as demonstrated by memory_usage and gc_calls. In this perspective, {SLmetrics} is more efficient and scalable than both packages as the memory usage is basically linear. See below:

## 1) define classes
set.seed(1903)
fct_actual    <- factor(sample(letters[1:3], size = 2e7, replace = TRUE))
fct_predicted <- factor(sample(letters[1:3], size = 2e7, replace = TRUE))

## 2) perform benchmark
benchmark(
    `{SLmetrics}` = SLmetrics::cmatrix(fct_actual, fct_predicted),
    `{MLmetrics}` = MLmetrics::ConfusionMatrix(fct_predicted, fct_actual),
    `{yardstick}` = yardstick::conf_mat(table(fct_actual, fct_predicted))
)
#> # A tibble: 3 × 4
#>   expression  execution_time memory_usage gc_calls
#>   <fct>             <bch:tm>    <bch:byt>    <dbl>
#> 1 {SLmetrics}         12.3ms           0B        0
#> 2 {MLmetrics}        648.5ms        763MB       19
#> 3 {yardstick}        654.7ms        763MB       19

{SLmetrics} can process 60x the data in the same time it takes {MLmetrics} and {yardstick} to process 40,000,000 data-points – without any additional memory cost.

Summary

The benchmarks suggests that {SLmetrics} is a strong contender to the more established packages {MLmetrics} and {yardstick} in terms of scalability, memory efficiency and speed.

Installing {SLmetrics}

{SLmetrics} is still under development and is therefore not on CRAN. But the latest release can be installed using {devtools}. A development version is also available for those living on the edge. See below:

Stable version

## install stable release
devtools::install_github(
  repo = 'https://github.com/serkor1/SLmetrics@*release',
  ref  = 'main'
)

Development version

## install development version
devtools::install_github(
  repo = 'https://github.com/serkor1/SLmetrics',
  ref  = 'development'
)

If you made it this far: Thank you for reading the blog post, and feel free to leave a comment here or in the repository.

Spatial modelling with GAMs in R workshop

Join our workshop on Spatial modelling with GAMs in R, which is a part of our workshops for Ukraine series! 


Here’s some more info: 


Title: Spatial modelling with GAMs in R


Date: Thursday, January 30th, 18:00 – 20:00 CET (Rome, Berlin, Paris timezone) 


Speaker: Sophie Lee is a statistician and educator who teaches a range of statistics and R coding courses to non-statisticians. Her goal is to provide accessible, engaging training to prove that statistics does not need to be scary! She has a PhD in Spatio-temporal Epidemiology from LSHTM and is a Fellow of the Higher Education Academy. Her research interests lie in spatial data analysis, planetary health, and Bayesian modelling.


Description: When modelling spatial data we are generally unable to use traditional modelling approaches, such as generalised linear models (GLMs), as the assumption that observations are independent of one another may be invalid. This is due to underlying similarities, including unobservable behaviours, climate, and other characteristics, that are shared between observations close to one another. There are extensions of GLMs that can be used to overcome this lack of independence between observations, often with the inclusion of structured random effects, that try to take account of the underlying spatial relationships. The issue arises when deciding how to structure these spatial random effects: how close is close enough to consider observations no longer independent?

This workshop introduces generalised additive models (GAMs) as a method for generating the underlying spatial structure needed to define spatially structured random effects. We will see how penalised smoothing splines can be applied to coordinates to generate a spatial plane with minimal user assumptions. This ensures the spatial model is relevant and unique to the setting being studied. Using the mgcv package in R, we will apply this approach to real-world data, incorporating the flexible spatial structure into a random effects model, which then can be interpreted similarly to any other spatial model.


Minimal registration fee: 20 euro (or 20 USD or 800 UAH)

Please note that the registration confirmation email will be sent 1 day before the workshop.

How can I register?


  • Save your donation receipt (after the donation is processed, there is an option to enter your email address on the website to which the donation receipt is sent)

  • Fill in the registration form, attaching a screenshot of a donation receipt (please attach the screenshot of the donation receipt that was emailed to you rather than the page you see after donation).

If you are not personally interested in attending, you can also contribute by sponsoring a participation of a student, who will then be able to participate for free. If you choose to sponsor a student, all proceeds will also go directly to organisations working in Ukraine. You can either sponsor a particular student or you can leave it up to us so that we can allocate the sponsored place to students who have signed up for the waiting list.


How can I sponsor a student?


  • Save your donation receipt (after the donation is processed, there is an option to enter your email address on the website to which the donation receipt is sent)

  • Fill in the sponsorship form, attaching the screenshot of the donation receipt (please attach the screenshot of the donation receipt that was emailed to you rather than the page you see after the donation). You can indicate whether you want to sponsor a particular student or we can allocate this spot ourselves to the students from the waiting list. You can also indicate whether you prefer us to prioritize students from developing countries when assigning place(s) that you sponsored.


If you are a university student and cannot afford the registration fee, you can also sign up for the waiting list here. (Note that you are not guaranteed to participate by signing up for the waiting list).


You can also find more information about this workshop series,  a schedule of our future workshops as well as a list of our past workshops which you can get the recordings & materials here.


Looking forward to seeing you during the workshop!



Latent Growth Curve Models using the Lavaan Package in R workshop

Join our workshop on Latent Growth Curve Models using the Lavaan Package in R, which is a part of our workshops for Ukraine series! 


Here’s some more info: 

Title: Latent Growth Curve Models using the Lavaan Package in R

Date: Thursday, January 16th, 18:00 – 20:00 CET (Rome, Berlin, Paris timezone)

Speaker: Rogier Kievit is Professor of Developmental Neuroscience at the Donders Institute in Nijmegen, where he leads the Lifespan Cognitive Dynamics Lab (https://lifespancognitivedynamics.com/). He studies changes in cognitive abilities across the lifespan using multivariate techniques including factor analysis, growth curve models, mixture models and timeseries analysis. He using R almost every day, especially Lavaan and ggplot, and has contributed to multiple packages (e.g. ggrain, regsem, iced). If you send him exciting longitudinal data there is a real risk he may abandon other more urgent tasks.

Description: Rogier Kievit is Professor of Developmental Neuroscience at the Donders Institute in Nijmegen, where he leads the Lifespan Cognitive Dynamics Lab (https://lifespancognitivedynamics.com/). He studies changes in cognitive abilities across the lifespan using multivariate techniques including factor analysis, growth curve models, mixture models and timeseries analysis. He using R almost every day, especially Lavaan and ggplot, and has contributed to multiple packages (e.g. ggrain, regsem, iced). If you send him exciting longitudinal data there is a real risk he may abandon other more urgent tasks.


Minimal registration fee: 20 euro (or 20 USD or 800 UAH)


Please note that the registration confirmation email will be sent 1 day before the workshop.


How can I register?


  • Save your donation receipt (after the donation is processed, there is an option to enter your email address on the website to which the donation receipt is sent)

  • Fill in the registration form, attaching a screenshot of a donation receipt (please attach the screenshot of the donation receipt that was emailed to you rather than the page you see after donation).

If you are not personally interested in attending, you can also contribute by sponsoring a participation of a student, who will then be able to participate for free. If you choose to sponsor a student, all proceeds will also go directly to organisations working in Ukraine. You can either sponsor a particular student or you can leave it up to us so that we can allocate the sponsored place to students who have signed up for the waiting list.


How can I sponsor a student?


  • Save your donation receipt (after the donation is processed, there is an option to enter your email address on the website to which the donation receipt is sent)

  • Fill in the sponsorship form, attaching the screenshot of the donation receipt (please attach the screenshot of the donation receipt that was emailed to you rather than the page you see after the donation). You can indicate whether you want to sponsor a particular student or we can allocate this spot ourselves to the students from the waiting list. You can also indicate whether you prefer us to prioritize students from developing countries when assigning place(s) that you sponsored.


If you are a university student and cannot afford the registration fee, you can also sign up for the waiting list here. (Note that you are not guaranteed to participate by signing up for the waiting list).


You can also find more information about this workshop series,  a schedule of our future workshops as well as a list of our past workshops which you can get the recordings & materials here.


Looking forward to seeing you during the workshop!

Satellite mapping of surface waters in R

Join our workshop on Satellite mapping of surface waters in R, which is a part of our workshops for Ukraine series! 

Here’s some more info: 

Title: Satellite mapping of surface waters in R

Date: Thursday, January 23rd, 18:00 – 20:00 CET (Rome, Berlin, Paris timezone)

Speaker: Lawrence Vulis is a senior hazard scientist at CoreLogic working on modelling climate impacts to natural hazards and property risk. He regularly works with statistical methods, numerical modelling, and geographic information systems (GIS) to interrogate natural hazard, property/building, and climate data. His background is in hydrology and geomorphology, with prior experience in the satellite imagery based monitoring and classification of coastal landscapes and surface water systems such as beaches, river deltas, and lakes.

Description: Surface waters such as rivers, streams, lakes, and reservoirs are an important source of freshwater and economic activity. Mapping such waters and their seasonal changes is crucial for understanding water resource availability or geomorphic activity. This workshop focuses on the interrogation of optical and multispectral satellite imagery for surface water mapping using R. We will examine different types of satellite imagery and how to extract surface water features. It is recommended but not required to have some basics in understanding geographic information systems (GIS) topics, image processing, and possibly some background in hydrology, geography, or earth science.

Minimal registration fee: 20 euro (or 20 USD or 800 UAH)


Please note that the registration confirmation email will be sent 1 day before the workshop.

How can I register?


  • Save your donation receipt (after the donation is processed, there is an option to enter your email address on the website to which the donation receipt is sent)

  • Fill in the registration form, attaching a screenshot of a donation receipt (please attach the screenshot of the donation receipt that was emailed to you rather than the page you see after donation).

If you are not personally interested in attending, you can also contribute by sponsoring a participation of a student, who will then be able to participate for free. If you choose to sponsor a student, all proceeds will also go directly to organisations working in Ukraine. You can either sponsor a particular student or you can leave it up to us so that we can allocate the sponsored place to students who have signed up for the waiting list.


How can I sponsor a student?


  • Save your donation receipt (after the donation is processed, there is an option to enter your email address on the website to which the donation receipt is sent)

  • Fill in the sponsorship form, attaching the screenshot of the donation receipt (please attach the screenshot of the donation receipt that was emailed to you rather than the page you see after the donation). You can indicate whether you want to sponsor a particular student or we can allocate this spot ourselves to the students from the waiting list. You can also indicate whether you prefer us to prioritize students from developing countries when assigning place(s) that you sponsored.


If you are a university student and cannot afford the registration fee, you can also sign up for the waiting list here. (Note that you are not guaranteed to participate by signing up for the waiting list).


You can also find more information about this workshop series,  a schedule of our future workshops as well as a list of our past workshops which you can get the recordings & materials here.


Looking forward to seeing you during the workshop!
{SLmetrics}: Machine Learning performance evaluation on steroids

Introduction
{SLmetrics} is a low-level R package designed for efficient performance evaluation in supervised AI/ML tasks. By leveraging {Rcpp} and {RcppEigen}, it ensures fast execution and memory efficiency, making it ideal for handling large-scale datasets. Built on the robust S3 class system, {SLmetrics} integrates seamlessly with stable R packages, ensuring reliability and ease of use for developers and data scientists alike.

Why?
{SLmetrics} combines simplicity with exceptional performance, setting it apart from other packages. While it draws inspiration from {MLmetrics} in its intuitive design, it outpaces it in terms of speed, memory efficiency, and the variety of available performance measures. In terms of features, {SLmetrics} offers functionality comparable to {yardstick} and {scikit-learn}, while being significantly faster.

Current benchmarks show that {SLmetrics} is between 20-70 times faster than {yardstick}, {MLmetrics}, and {mlr3measures} (See Figure 1).

Alt Text
Figure 1. Median execution time of a 2×2 confusion matrix using {SLmetrics}, {MLmetrics}, {mlr3measures} and {yardstick}. The source code can be found in the {SLmetrics} repository on Github.
Whether you’re working with simple models or complex machine learning pipelines, {SLmetrics} provides a highly efficient, reliable solution for model evaluation.

Basic usage of {SLmetrics}
Load {SLmetrics},

library(SLmetrics)
We recode the Species variable and convert the problem to a binary classification problem,

# 1) recode Iris
# to binary classification
# problem
iris$species_num <- as.numeric(
  iris$Species == "virginica"
)

# 2) fit the logistic
# regression
model <- glm(
  formula = species_num ~ Sepal.Length + Sepal.Width,
  data    = iris,
  family  = binomial(
    link = "logit"
  )
)

# 3) generate predicted
# classes
response <- predict(model, type = "response")

# 3.1) generate actual
# classes
actual <- factor(
  x = iris$species_num,
  levels = c(1,0),
  labels = c("Virginica", "Others")
)
Construct the precision-recall curve,

# 4) generate precision-recall
# curve
roc <- prROC(
  actual   = actual,
  response = response
)
Visualize the precision-recall curve,

# 5) plot by species
plot(roc)

Summarise to get the area under the curve metric for each class,

# 5.1) summarise
summary(roc)
#> Reciever Operator Characteristics 
#> ================================================================================
#> AUC
#>  - Others: 0.473
#>  - Virginica: 0.764
The precision-recall function also supports custom thresholds,

# 6) provide custom
# threholds
roc <- prROC(
  actual     = actual,
  response   = response,
  thresholds = seq(0, 1, length.out = 4)
)
Visualize the precision-recall curve with custom thresholds,

# 5) plot by species
plot(roc)


Installing {SLmetrics}
The stable release {SLmetrics} can be installed as follows,
devtools::install_github(
  repo = 'https://github.com/serkor1/SLmetrics@*release',
  ref  = 'main'
)
The development version of {SLmetrics} can be installed as follows,
devtools::install_github(
  repo = 'https://github.com/serkor1/SLmetrics',
  ref  = 'development'
)

Get involved with {SLmetrics}
We’re building something exciting with {SLmetrics}, and your contributions can make a real impact!

While {SLmetrics} isn’t on CRAN yet—it’s a work in progress striving for excellence—this is your chance to shape its future. We’re thrilled to offer co-authorship for substantial contributions, recognizing your expertise and effort.

Even smaller improvements will earn you a spot on our contributor list, showcasing your valuable role in enhancing {SLmetrics}. Join us in creating a high-quality tool that benefits the entire R community. Check out the repository and start contributing today!

Crafting Custom and Reproducible PDF Reports with Quarto and Typst in R workshop

Join our workshop on Crafting Custom and Reproducible PDF Reports with Quarto and Typst in R, which is a part of our workshops for Ukraine series! 

Here’s some more info: 

Title: Crafting Custom and Reproducible PDF Reports with Quarto and Typst in R

Date: Thursday, December 19th, 18:00 – 20:00 CEST (Rome, Berlin, Paris timezone)

Speaker: Riva Quiroga is a linguist and educator based in Valparaíso, Chile. She is a Software Sustainability Insitute Fellow, part of the R-Ladies Global Leadership Team, and a Women Techmakers Ambassador.

Description: In this workshop, we will cover the process of creating a fully customized and reproducible PDF report using Quarto and Typst, a modern typesetting and markup language designed for creating high-quality PDFs that offers a more user-friendly alternative to LaTeX. After walking participants through the building blocks of document layout, the workshop will focus on Quarto’s ability to translate CSS properties into Typst properties, a feature that expands the possibilities for customizing a document’s appearance.

Minimal registration fee: 20 euro (or 20 USD or 800 UAH)


Please note that the registration confirmation email will be sent 1 day before the workshop.


How can I register?


  • Save your donation receipt (after the donation is processed, there is an option to enter your email address on the website to which the donation receipt is sent)

  • Fill in the registration form, attaching a screenshot of a donation receipt (please attach the screenshot of the donation receipt that was emailed to you rather than the page you see after donation).

If you are not personally interested in attending, you can also contribute by sponsoring a participation of a student, who will then be able to participate for free. If you choose to sponsor a student, all proceeds will also go directly to organisations working in Ukraine. You can either sponsor a particular student or you can leave it up to us so that we can allocate the sponsored place to students who have signed up for the waiting list.


How can I sponsor a student?


  • Save your donation receipt (after the donation is processed, there is an option to enter your email address on the website to which the donation receipt is sent)

  • Fill in the sponsorship form, attaching the screenshot of the donation receipt (please attach the screenshot of the donation receipt that was emailed to you rather than the page you see after the donation). You can indicate whether you want to sponsor a particular student or we can allocate this spot ourselves to the students from the waiting list. You can also indicate whether you prefer us to prioritize students from developing countries when assigning place(s) that you sponsored.


If you are a university student and cannot afford the registration fee, you can also sign up for the waiting list here. (Note that you are not guaranteed to participate by signing up for the waiting list).


You can also find more information about this workshop series,  a schedule of our future workshops as well as a list of our past workshops which you can get the recordings & materials here.


Looking forward to seeing you during the workshop!
DataCamp’s RADAR: Forward Edition

As 2024 draws to a close, which new trends should you be paying attention to?


Join DataCamp’s flagship conference RADAR: Forward Edition to explore developments in data and AI that will shape 2025 and beyond.

  • Date: November 13, 2024.
  • Location: Online
  • Cost: Free of charge

Experts from top tech organizations will cover topics such as generative AI, how leadership can leverage and transform their organizations with AI, career development in AI, and more.


Register now for free

Introduction to generalized linear models in R workshop

Join our workshop on Introduction to generalized linear models in R, which is a part of our workshops for Ukraine series! 

Here’s some more info: 

Title:  Introduction to generalized linear models in R

Date: Thursday, December 5th, 18:00 – 20:00 CET (Rome, Berlin, Paris timezone)

Speaker: Bodo Winter is Professor of Linguistics at the Dept. of Linguistics and Communication, University of Birmingham, and a UKRI Future Leaders Fellow for the project “Making numbers meaningful”. He uses data science-driven methods to study gesture, iconicity, and numerical communication in language. Bodo has authored Statistics for Linguists: An Introduction Using R and co-founded the Birmingham Statistics for Linguists Summer School.

Description: In this talk, you’ll learn about the fundamentals of generalized linear models, a powerful extension of the general linear model/multiple regression. We will discuss different distributions that can be used to model a diverse range of data-generating processes and how to interpret models that use different link functions. In the hands-on part of the workshop, we’ll work through a dataset for which we are going to use a mixed Poisson regression model, implemented with the package brms. Materials for the hands-on session will be distributed a couple days prior to the workshop.

Minimal registration fee: 20 euro (or 20 USD or 800 UAH)


Please note that the registration confirmation email will be sent 1 day before the workshop.


How can I register?


  • Save your donation receipt (after the donation is processed, there is an option to enter your email address on the website to which the donation receipt is sent)

  • Fill in the registration form, attaching a screenshot of a donation receipt (please attach the screenshot of the donation receipt that was emailed to you rather than the page you see after donation).

If you are not personally interested in attending, you can also contribute by sponsoring a participation of a student, who will then be able to participate for free. If you choose to sponsor a student, all proceeds will also go directly to organisations working in Ukraine. You can either sponsor a particular student or you can leave it up to us so that we can allocate the sponsored place to students who have signed up for the waiting list.


How can I sponsor a student?


  • Save your donation receipt (after the donation is processed, there is an option to enter your email address on the website to which the donation receipt is sent)

  • Fill in the sponsorship form, attaching the screenshot of the donation receipt (please attach the screenshot of the donation receipt that was emailed to you rather than the page you see after the donation). You can indicate whether you want to sponsor a particular student or we can allocate this spot ourselves to the students from the waiting list. You can also indicate whether you prefer us to prioritize students from developing countries when assigning place(s) that you sponsored.


If you are a university student and cannot afford the registration fee, you can also sign up for the waiting list here. (Note that you are not guaranteed to participate by signing up for the waiting list).


You can also find more information about this workshop series,  a schedule of our future workshops as well as a list of our past workshops which you can get the recordings & materials here.


Looking forward to seeing you during the workshop!